| Red | Green | Blue | |
| z | 17.64 | ||
| znorm | Inf | ||
| sky | -NaN | -Inf | -NaN |
| S/N | 30.5 | 52.8 | 61.3 |
| S/N(c) | 0.0 | 0.0 | 0.0 |
| SN(E/C) |
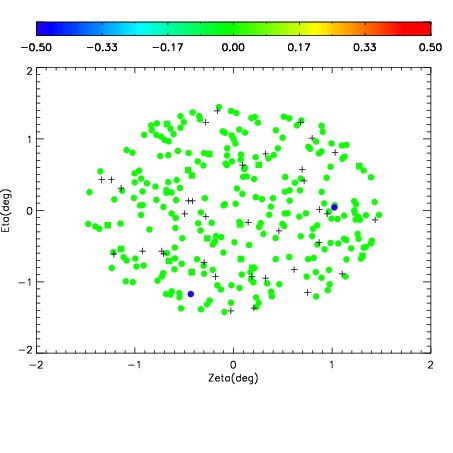
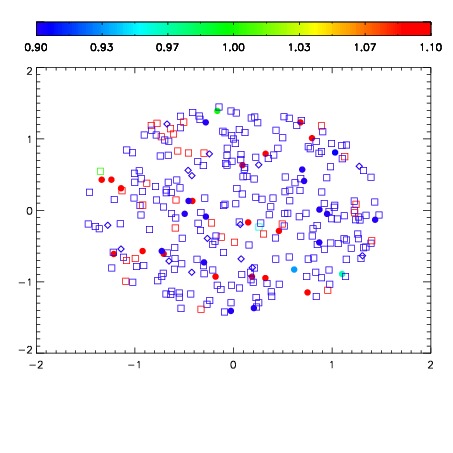
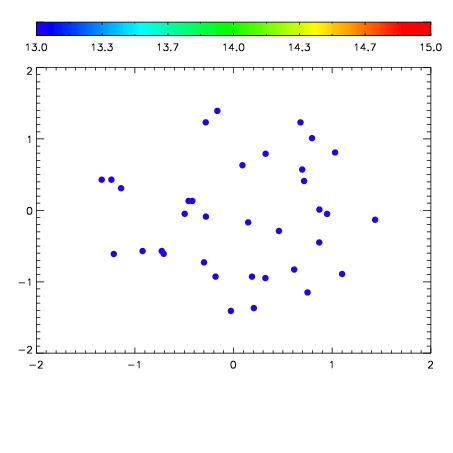

| Frame | Nreads | Zeropoints | Mag plots | Spatial mag deviation | Spatial sky 16325A emission deviations (filled: sky, open: star) | Spatial sky continuum emission | Spatial sky telluric CO2 absorption deviations (filled: H < 10) | |||||||||||||||||||||||
| 0 | 0 |
|
|
|
|
|
|
| IPAIR | NAME | SHIFT | NEWSHIFT | S/N | NAME | SHIFT | NEWSHIFT | S/N |
| 0 | 17330072 | 0.505256 | 0.00000 | 19.1928 | 17330069 | 0.00141207 | 0.503844 | 19.2108 |
| 1 | 17330068 | 0.503236 | 0.00202000 | 19.1920 | 17330073 | 0.00109960 | 0.504156 | 19.2030 |
| 2 | 17330067 | 0.503019 | 0.00223702 | 19.1915 | 17330070 | 0.000839025 | 0.504417 | 19.1649 |
| 3 | 17330071 | 0.504435 | 0.000820994 | 19.1504 | 17330066 | 0.00000 | 0.505256 | 19.1158 |