| Red | Green | Blue | |
| z | 17.63 | ||
| znorm | Inf | ||
| sky | -Inf | -NaN | -Inf |
| S/N | 29.6 | 49.8 | 59.0 |
| S/N(c) | 0.0 | 0.0 | 0.0 |
| SN(E/C) |
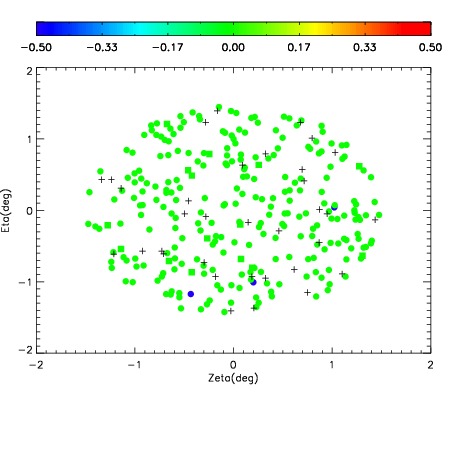
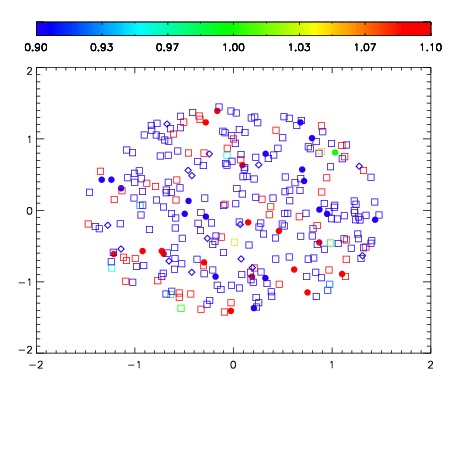
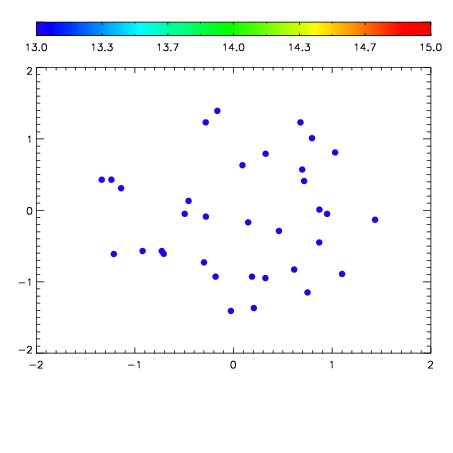

| Frame | Nreads | Zeropoints | Mag plots | Spatial mag deviation | Spatial sky 16325A emission deviations (filled: sky, open: star) | Spatial sky continuum emission | Spatial sky telluric CO2 absorption deviations (filled: H < 10) | |||||||||||||||||||||||
| 0 | 0 |
|
|
|
|
|
|
| IPAIR | NAME | SHIFT | NEWSHIFT | S/N | NAME | SHIFT | NEWSHIFT | S/N |
| 0 | 17870054 | 0.518013 | 0.00000 | 19.1385 | 17870052 | 0.00330706 | 0.514706 | 19.1415 |
| 1 | 17870053 | 0.516881 | 0.00113201 | 19.0837 | 17870055 | 0.00327481 | 0.514738 | 19.1135 |
| 2 | 17870049 | 0.513779 | 0.00423402 | 19.0649 | 17870051 | 0.00320321 | 0.514810 | 19.1021 |
| 3 | 17870050 | 0.514989 | 0.00302398 | 18.9844 | 17870048 | 0.00000 | 0.518013 | 19.0896 |