| Red | Green | Blue | |
| z | 17.64 | ||
| znorm | Inf | ||
| sky | -Inf | -Inf | -Inf |
| S/N | 31.5 | 51.4 | 60.7 |
| S/N(c) | 0.0 | 0.0 | 0.0 |
| SN(E/C) |

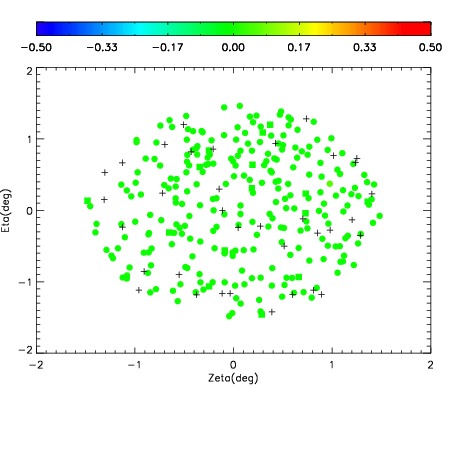
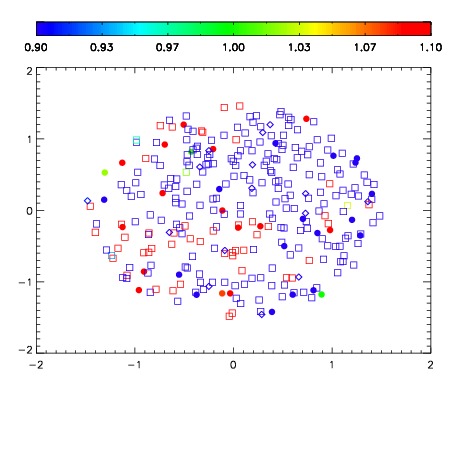


| Frame | Nreads | Zeropoints | Mag plots | Spatial mag deviation | Spatial sky 16325A emission deviations (filled: sky, open: star) | Spatial sky continuum emission | Spatial sky telluric CO2 absorption deviations (filled: H < 10) | |||||||||||||||||||||||
| 0 | 0 |
|
|
|
|
|
|
| IPAIR | NAME | SHIFT | NEWSHIFT | S/N | NAME | SHIFT | NEWSHIFT | S/N |
| 0 | 17320083 | 0.00200007 | 0.00000 | 19.2016 | 17320084 | -0.504032 | 0.506032 | 19.2228 |
| 1 | 17320086 | 0.00107308 | 0.000926990 | 19.2705 | 17320085 | -0.503569 | 0.505569 | 19.2678 |
| 2 | 17320079 | 0.00000 | 0.00200007 | 19.2435 | 17320080 | -0.503387 | 0.505387 | 19.2276 |
| 3 | 17320082 | 0.000828828 | 0.00117124 | 19.1575 | 17320081 | -0.503699 | 0.505699 | 19.1977 |