| Red | Green | Blue | |
| z | 17.64 | ||
| znorm | Inf | ||
| sky | -NaN | -Inf | -NaN |
| S/N | 30.3 | 50.6 | 59.0 |
| S/N(c) | 0.0 | 0.0 | 0.0 |
| SN(E/C) |


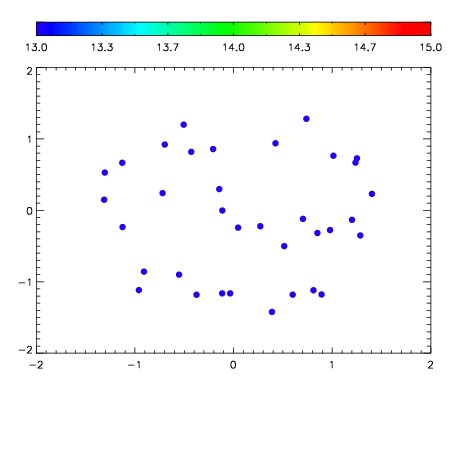

| Frame | Nreads | Zeropoints | Mag plots | Spatial mag deviation | Spatial sky 16325A emission deviations (filled: sky, open: star) | Spatial sky continuum emission | Spatial sky telluric CO2 absorption deviations (filled: H < 10) | |||||||||||||||||||||||
| 0 | 0 |
|
|
|
|
|
|
| IPAIR | NAME | SHIFT | NEWSHIFT | S/N | NAME | SHIFT | NEWSHIFT | S/N |
| 0 | 17350053 | 0.503326 | 0.00000 | 19.1304 | 17350052 | 0.00000 | 0.503326 | 19.0657 |
| 1 | 17350057 | 0.499867 | 0.00345901 | 19.2585 | 17350055 | 0.00307179 | 0.500254 | 19.2557 |
| 2 | 17350054 | 0.502958 | 0.000367999 | 19.2309 | 17350056 | 0.00360285 | 0.499723 | 19.2520 |
| 3 | 17350058 | 0.500179 | 0.00314701 | 19.2239 | 17350059 | 0.00393698 | 0.499389 | 19.2180 |