| Red | Green | Blue | |
| z | 17.64 | ||
| znorm | Inf | ||
| sky | -Inf | -NaN | -Inf |
| S/N | 4.7 | 7.7 | 9.2 |
| S/N(c) | 0.0 | 0.0 | 0.0 |
| SN(E/C) |
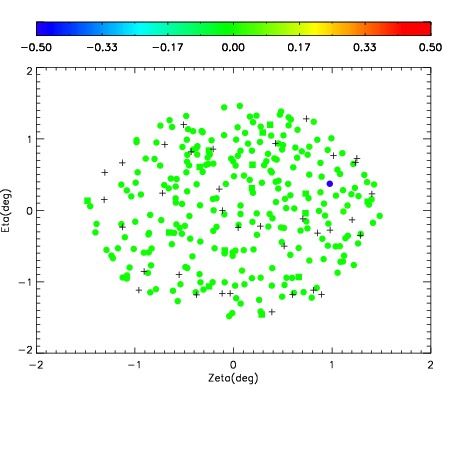
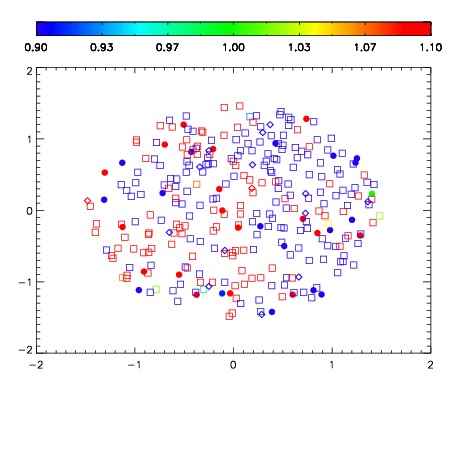
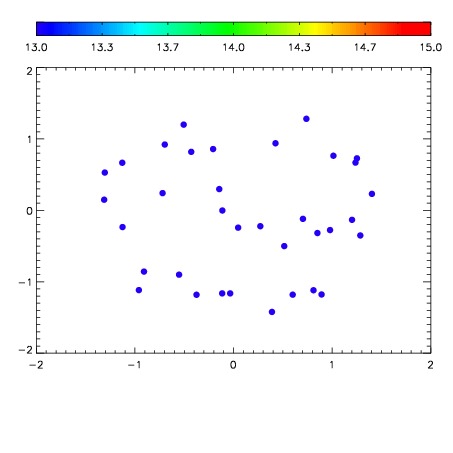

| Frame | Nreads | Zeropoints | Mag plots | Spatial mag deviation | Spatial sky 16325A emission deviations (filled: sky, open: star) | Spatial sky continuum emission | Spatial sky telluric CO2 absorption deviations (filled: H < 10) | |||||||||||||||||||||||
| 0 | 0 |
|
|
|
|
|
|
| IPAIR | NAME | SHIFT | NEWSHIFT | S/N | NAME | SHIFT | NEWSHIFT | S/N |
| 0 | 17590056 | 0.507193 | 0.00000 | 15.4016 | 17590058 | 0.000507444 | 0.506686 | 16.1469 |
| 1 | 17590060 | 0.503674 | 0.00351906 | 17.1536 | 17590062 | 0.00120565 | 0.505987 | 18.0990 |
| 2 | 17590061 | 0.504239 | 0.00295401 | 16.6927 | 17590059 | 0.000708865 | 0.506484 | 16.8541 |