| Red | Green | Blue | |
| z | 17.64 | ||
| znorm | Inf | ||
| sky | -NaN | -Inf | -NaN |
| S/N | 25.7 | 44.2 | 50.1 |
| S/N(c) | 0.0 | 0.0 | 0.0 |
| SN(E/C) |
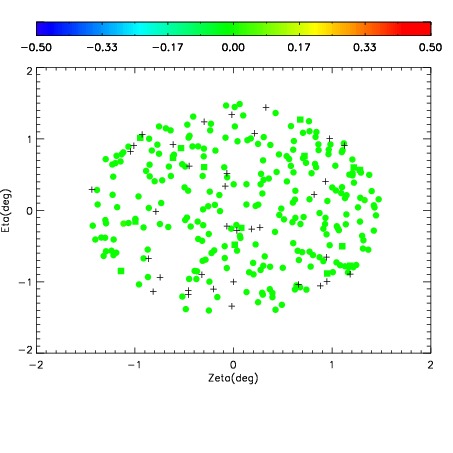
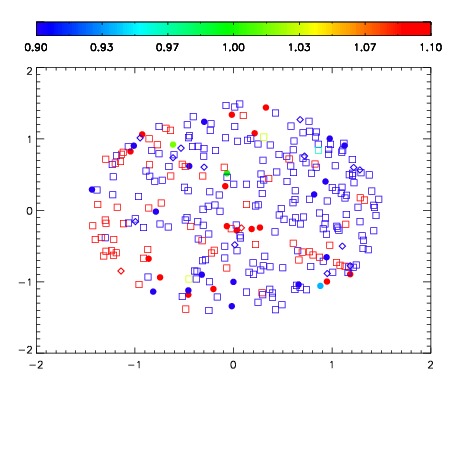
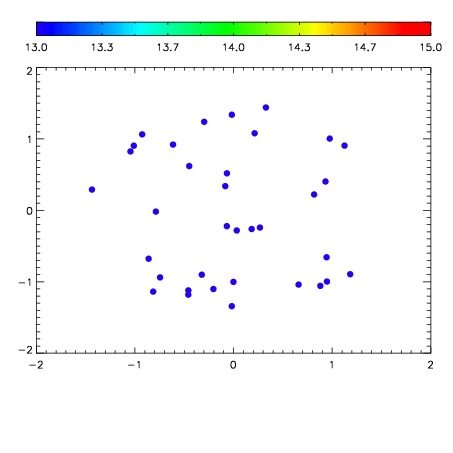

| Frame | Nreads | Zeropoints | Mag plots | Spatial mag deviation | Spatial sky 16325A emission deviations (filled: sky, open: star) | Spatial sky continuum emission | Spatial sky telluric CO2 absorption deviations (filled: H < 10) | |||||||||||||||||||||||
| 0 | 0 |
|
|
|
|
|
|
| IPAIR | NAME | SHIFT | NEWSHIFT | S/N | NAME | SHIFT | NEWSHIFT | S/N |
| 0 | 18450049 | 0.499524 | 0.00000 | 15.6352 | 18450051 | 0.000406852 | 0.499117 | 17.1829 |
| 1 | 18450041 | 0.497814 | 0.00171000 | 19.1637 | 18450040 | 0.00000 | 0.499524 | 19.1614 |
| 2 | 18450042 | 0.497206 | 0.00231799 | 19.1499 | 18450044 | 0.000347896 | 0.499176 | 19.1486 |
| 3 | 18450045 | 0.497022 | 0.00250199 | 19.1224 | 18450043 | 0.000911266 | 0.498613 | 19.1002 |
| 4 | 18450046 | 0.497584 | 0.00194001 | 18.9158 | 18450047 | -0.000969217 | 0.500493 | 18.3554 |