| Red | Green | Blue | |
| z | 17.64 | ||
| znorm | Inf | ||
| sky | -Inf | -Inf | -Inf |
| S/N | 21.3 | 37.2 | 41.9 |
| S/N(c) | 0.0 | 0.0 | 0.0 |
| SN(E/C) |
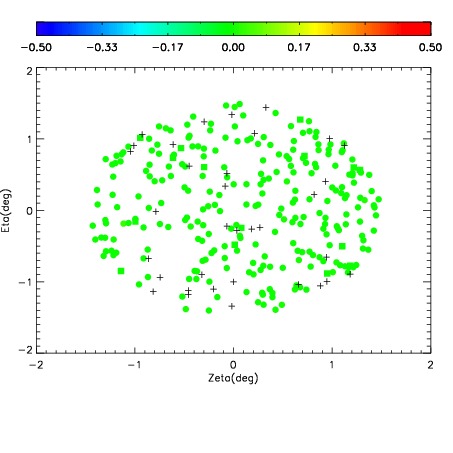
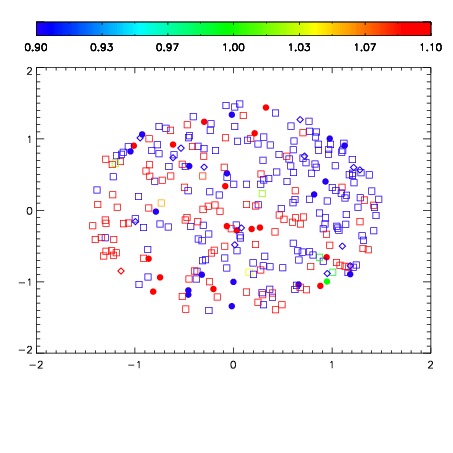


| Frame | Nreads | Zeropoints | Mag plots | Spatial mag deviation | Spatial sky 16325A emission deviations (filled: sky, open: star) | Spatial sky continuum emission | Spatial sky telluric CO2 absorption deviations (filled: H < 10) | |||||||||||||||||||||||
| 0 | 0 |
|
|
|
|
|
|
| IPAIR | NAME | SHIFT | NEWSHIFT | S/N | NAME | SHIFT | NEWSHIFT | S/N |
| 0 | 18480017 | 0.505372 | 0.00000 | 18.8267 | 18480018 | 0.00175672 | 0.503615 | 18.7510 |
| 1 | 18480016 | 0.505173 | 0.000198960 | 18.8792 | 18480014 | 0.00148779 | 0.503884 | 18.9277 |
| 2 | 18480013 | 0.504498 | 0.000873983 | 18.8662 | 18480015 | 0.00152138 | 0.503851 | 18.7580 |
| 3 | 18480012 | 0.504148 | 0.00122398 | 18.8193 | 18480011 | 0.00000 | 0.505372 | 18.4015 |