| Red | Green | Blue | |
| z | 17.64 | ||
| znorm | Inf | ||
| sky | -NaN | -NaN | -NaN |
| S/N | 27.0 | 46.7 | 55.4 |
| S/N(c) | 0.0 | 0.0 | 0.0 |
| SN(E/C) |
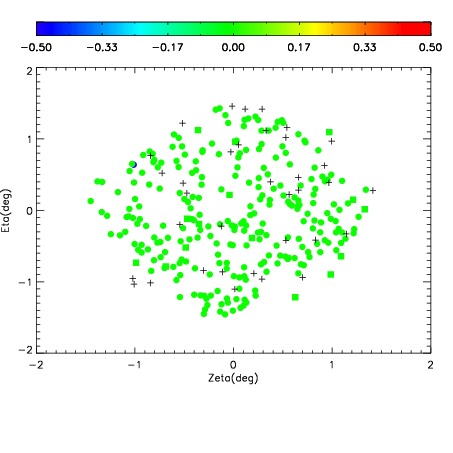
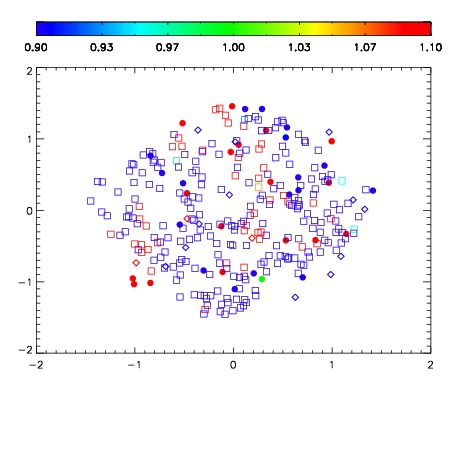


| Frame | Nreads | Zeropoints | Mag plots | Spatial mag deviation | Spatial sky 16325A emission deviations (filled: sky, open: star) | Spatial sky continuum emission | Spatial sky telluric CO2 absorption deviations (filled: H < 10) | |||||||||||||||||||||||
| 0 | 0 |
|
|
|
|
|
|
| IPAIR | NAME | SHIFT | NEWSHIFT | S/N | NAME | SHIFT | NEWSHIFT | S/N |
| 0 | 17320017 | 0.506798 | 0.00000 | 19.1037 | 17320011 | 0.00000 | 0.506798 | 19.0841 |
| 1 | 17320013 | 0.506755 | 4.30346e-05 | 19.0810 | 17320014 | -0.000125042 | 0.506923 | 19.0727 |
| 2 | 17320012 | 0.506184 | 0.000614047 | 19.0473 | 17320018 | 0.000673253 | 0.506125 | 19.0401 |
| 3 | 17320016 | 0.506646 | 0.000152051 | 18.9696 | 17320015 | -0.000211856 | 0.507010 | 18.9861 |