| Red | Green | Blue | |
| z | 17.64 | ||
| znorm | Inf | ||
| sky | -Inf | -Inf | -Inf |
| S/N | 24.5 | 42.6 | 50.4 |
| S/N(c) | 0.0 | 0.0 | 0.0 |
| SN(E/C) |
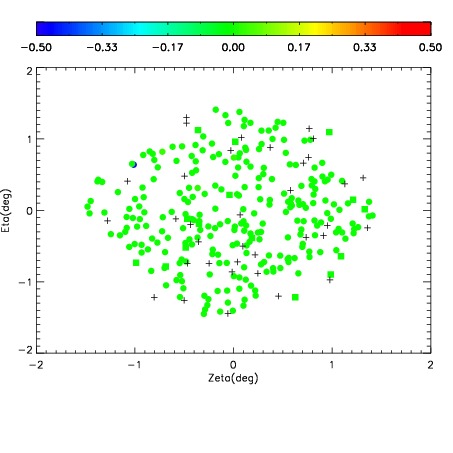
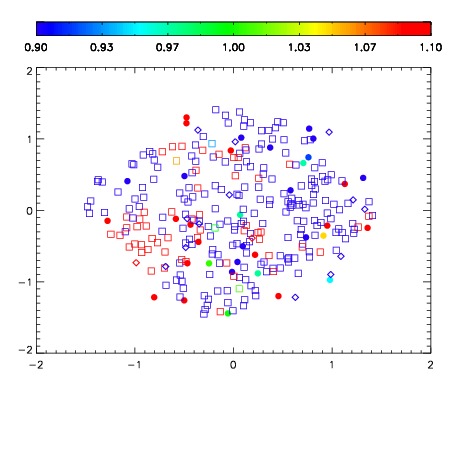


| Frame | Nreads | Zeropoints | Mag plots | Spatial mag deviation | Spatial sky 16325A emission deviations (filled: sky, open: star) | Spatial sky continuum emission | Spatial sky telluric CO2 absorption deviations (filled: H < 10) | |||||||||||||||||||||||
| 0 | 0 |
|
|
|
|
|
|
| IPAIR | NAME | SHIFT | NEWSHIFT | S/N | NAME | SHIFT | NEWSHIFT | S/N |
| 0 | 17330016 | 0.508231 | 0.00000 | 18.8296 | 17330014 | 0.000439341 | 0.507792 | 18.6833 |
| 1 | 17330012 | 0.506903 | 0.00132799 | 18.9918 | 17330011 | 0.00000 | 0.508231 | 19.0032 |
| 2 | 17330017 | 0.507860 | 0.000370979 | 18.9073 | 17330018 | 0.000860977 | 0.507370 | 18.8760 |
| 3 | 17330013 | 0.507209 | 0.00102198 | 18.8695 | 17330015 | 1.01439e-05 | 0.508221 | 18.7896 |