| Red | Green | Blue | |
| z | 17.64 | ||
| znorm | Inf | ||
| sky | -NaN | -Inf | -NaN |
| S/N | 24.4 | 44.6 | 51.2 |
| S/N(c) | 0.0 | 0.0 | 0.0 |
| SN(E/C) |
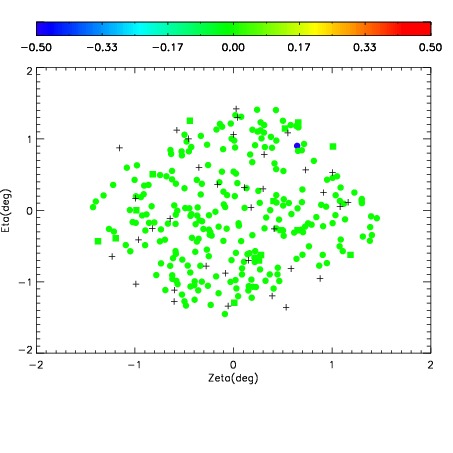
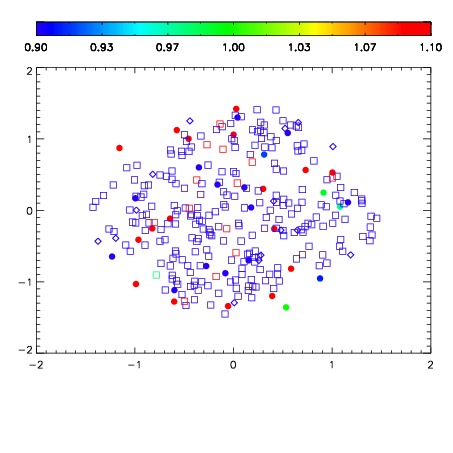
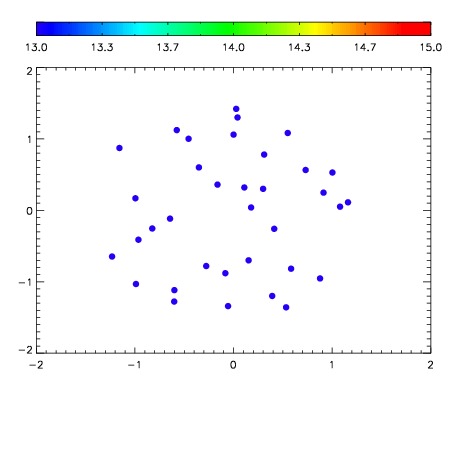

| Frame | Nreads | Zeropoints | Mag plots | Spatial mag deviation | Spatial sky 16325A emission deviations (filled: sky, open: star) | Spatial sky continuum emission | Spatial sky telluric CO2 absorption deviations (filled: H < 10) | |||||||||||||||||||||||
| 0 | 0 |
|
|
|
|
|
|
| IPAIR | NAME | SHIFT | NEWSHIFT | S/N | NAME | SHIFT | NEWSHIFT | S/N |
| 0 | 19390017 | 0.489461 | 0.00000 | 19.0570 | 19390014 | 0.00120681 | 0.488254 | 19.0434 |
| 1 | 19390016 | 0.489380 | 8.10027e-05 | 19.0558 | 19390015 | 0.000932183 | 0.488529 | 19.0091 |
| 2 | 19390013 | 0.489314 | 0.000147015 | 19.0004 | 19390011 | 0.00000 | 0.489461 | 18.9156 |
| 3 | 19390012 | 0.488791 | 0.000670016 | 18.9391 | 19390018 | -0.00361853 | 0.493080 | 18.8403 |