| Red | Green | Blue | |
| z | 17.64 | ||
| znorm | Inf | ||
| sky | -NaN | -Inf | -Inf |
| S/N | 21.1 | 38.2 | 43.5 |
| S/N(c) | 0.0 | 0.0 | 0.0 |
| SN(E/C) |
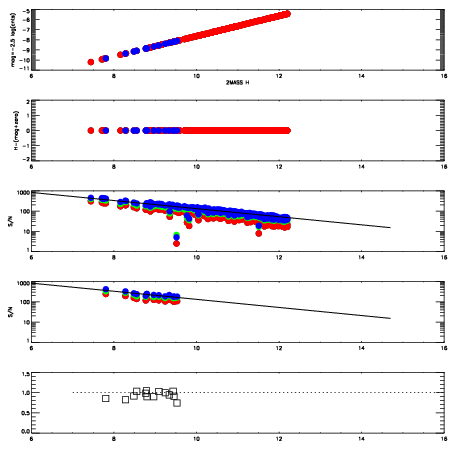
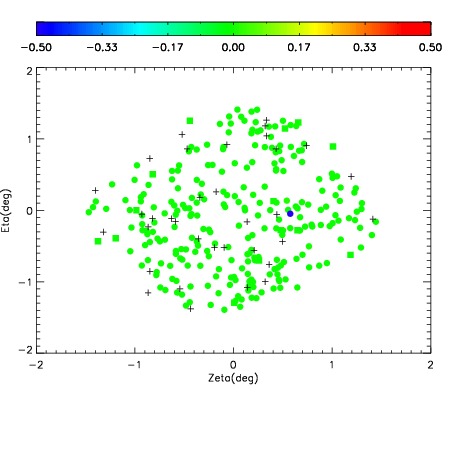
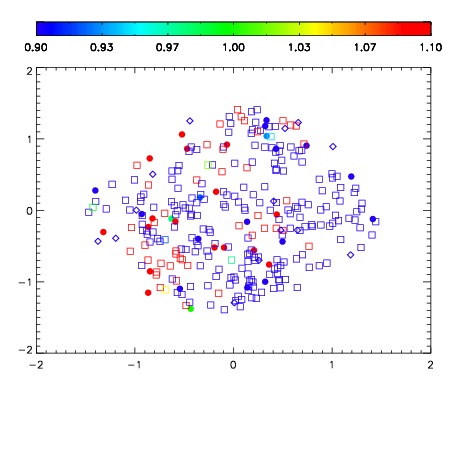


| Frame | Nreads | Zeropoints | Mag plots | Spatial mag deviation | Spatial sky 16325A emission deviations (filled: sky, open: star) | Spatial sky continuum emission | Spatial sky telluric CO2 absorption deviations (filled: H < 10) | |||||||||||||||||||||||
| 0 | 0 |
|
|
|
|
|
|
| IPAIR | NAME | SHIFT | NEWSHIFT | S/N | NAME | SHIFT | NEWSHIFT | S/N |
| 0 | 19420059 | 0.482501 | 0.00000 | 18.3772 | 19420064 | -0.00314632 | 0.485647 | 18.6160 |
| 1 | 19420062 | 0.480757 | 0.00174400 | 18.8285 | 19420061 | -0.00227362 | 0.484775 | 18.7891 |
| 2 | 19420063 | 0.481009 | 0.00149199 | 18.7976 | 19420060 | -0.00243064 | 0.484932 | 18.7444 |
| 3 | 19420058 | 0.481921 | 0.000580013 | 18.0899 | 19420065 | -0.00413118 | 0.486632 | 18.5908 |
| 4 | 19420066 | 0.480668 | 0.00183299 | 16.8361 | 19420057 | 0.00000 | 0.482501 | 17.7961 |