| Red | Green | Blue | |
| z | 17.64 | ||
| znorm | Inf | ||
| sky | -Inf | -Inf | -NaN |
| S/N | 8.9 | 19.4 | 21.6 |
| S/N(c) | 0.0 | 0.0 | 0.0 |
| SN(E/C) |
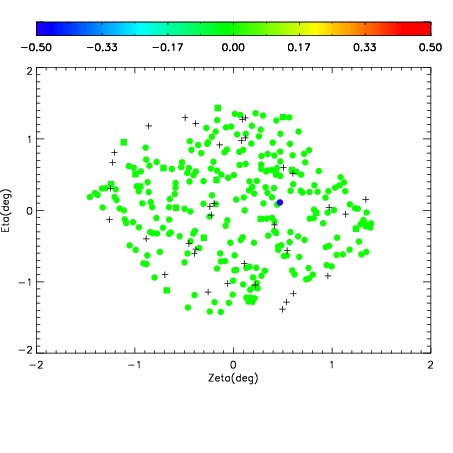
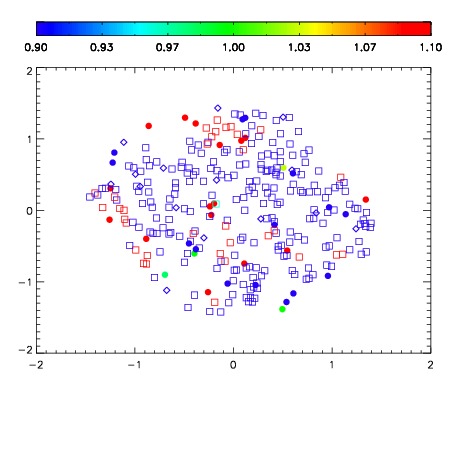


| Frame | Nreads | Zeropoints | Mag plots | Spatial mag deviation | Spatial sky 16325A emission deviations (filled: sky, open: star) | Spatial sky continuum emission | Spatial sky telluric CO2 absorption deviations (filled: H < 10) | |||||||||||||||||||||||
| 0 | 0 |
|
|
|
|
|
|
| IPAIR | NAME | SHIFT | NEWSHIFT | S/N | NAME | SHIFT | NEWSHIFT | S/N |
| 0 | 19600070 | 0.00000 | 0.00000 | 17.4180 | 19600075 | -0.497731 | 0.497731 | 16.8610 |
| 1 | 19600073 | -0.000905192 | 0.000905192 | 18.2218 | 19600072 | -0.494973 | 0.494973 | 18.5481 |
| 2 | 19600074 | -0.000526536 | 0.000526536 | 18.0518 | 19600071 | -0.493454 | 0.493454 | 18.3084 |