| Red | Green | Blue | |
| z | 17.64 | ||
| znorm | Inf | ||
| sky | -Inf | -Inf | -Inf |
| S/N | 28.7 | 50.2 | 57.6 |
| S/N(c) | 0.0 | 0.0 | 0.0 |
| SN(E/C) |
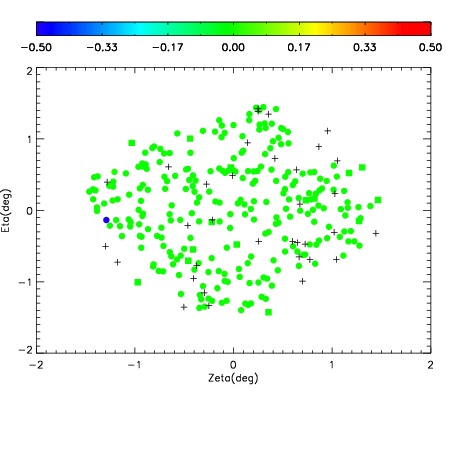
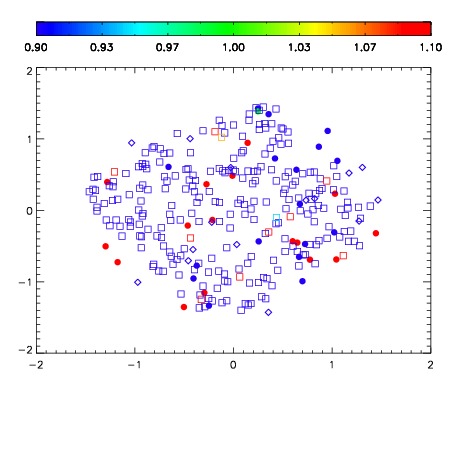
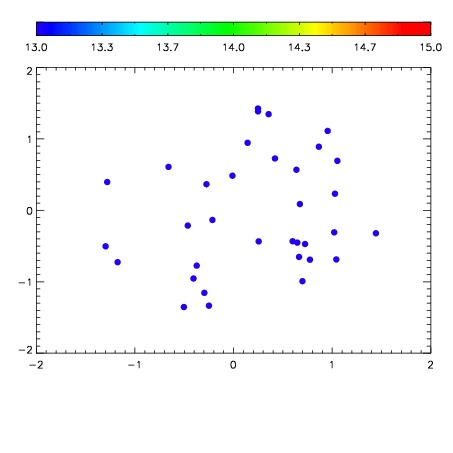

| Frame | Nreads | Zeropoints | Mag plots | Spatial mag deviation | Spatial sky 16325A emission deviations (filled: sky, open: star) | Spatial sky continuum emission | Spatial sky telluric CO2 absorption deviations (filled: H < 10) | |||||||||||||||||||||||
| 0 | 0 |
|
|
|
|
|
|
| IPAIR | NAME | SHIFT | NEWSHIFT | S/N | NAME | SHIFT | NEWSHIFT | S/N |
| 0 | 19710061 | 0.492352 | 0.00000 | 19.0897 | 19710063 | 0.000806922 | 0.491545 | 19.0736 |
| 1 | 19710065 | 0.488262 | 0.00409001 | 19.1690 | 19710066 | 0.00143165 | 0.490920 | 19.1676 |
| 2 | 19710060 | 0.491589 | 0.000762999 | 19.0931 | 19710059 | 0.00000 | 0.492352 | 19.0754 |
| 3 | 19710064 | 0.488890 | 0.00346202 | 19.0924 | 19710062 | 0.00135268 | 0.490999 | 19.0745 |