| Red | Green | Blue | |
| z | 17.64 | ||
| znorm | Inf | ||
| sky | -Inf | -Inf | -Inf |
| S/N | 25.1 | 42.6 | 45.9 |
| S/N(c) | 0.0 | 0.0 | 0.0 |
| SN(E/C) |

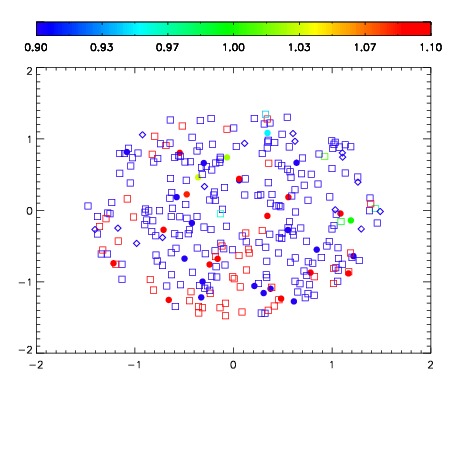


| Frame | Nreads | Zeropoints | Mag plots | Spatial mag deviation | Spatial sky 16325A emission deviations (filled: sky, open: star) | Spatial sky continuum emission | Spatial sky telluric CO2 absorption deviations (filled: H < 10) | |||||||||||||||||||||||
| 0 | 0 |
|
|
|
|
|
|
| IPAIR | NAME | SHIFT | NEWSHIFT | S/N | NAME | SHIFT | NEWSHIFT | S/N |
| 0 | 20030026 | 0.498333 | 0.00000 | 18.9279 | 20030028 | -0.00676173 | 0.505095 | 18.9698 |
| 1 | 20030027 | 0.497322 | 0.00101101 | 18.9778 | 20030025 | 0.00111343 | 0.497220 | 18.9731 |
| 2 | 20030022 | 0.493856 | 0.00447699 | 18.6601 | 20030024 | 0.00107568 | 0.497257 | 18.8943 |
| 3 | 20030023 | 0.494654 | 0.00367901 | 18.5351 | 20030021 | 0.00000 | 0.498333 | 18.4862 |