| Red | Green | Blue | |
| z | 17.64 | ||
| znorm | Inf | ||
| sky | -Inf | -Inf | -Inf |
| S/N | 14.5 | 24.1 | 25.3 |
| S/N(c) | 0.0 | 0.0 | 0.0 |
| SN(E/C) |
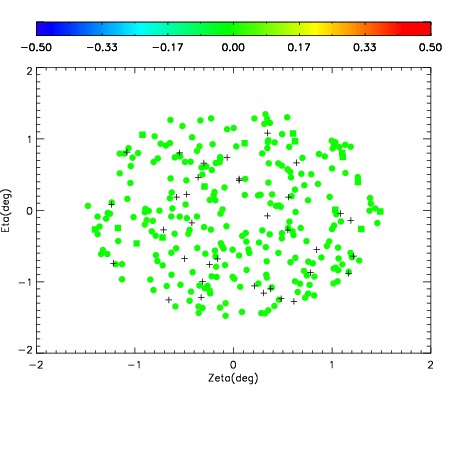
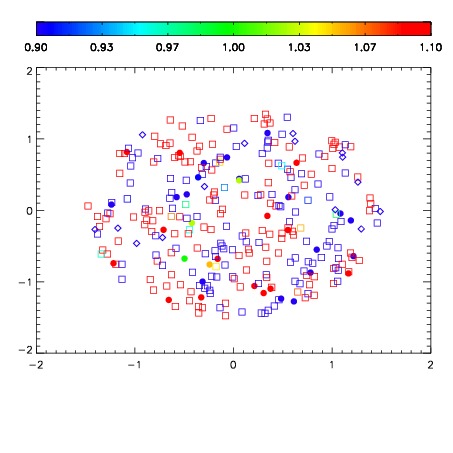


| Frame | Nreads | Zeropoints | Mag plots | Spatial mag deviation | Spatial sky 16325A emission deviations (filled: sky, open: star) | Spatial sky continuum emission | Spatial sky telluric CO2 absorption deviations (filled: H < 10) | |||||||||||||||||||||||
| 0 | 0 |
|
|
|
|
|
|
| IPAIR | NAME | SHIFT | NEWSHIFT | S/N | NAME | SHIFT | NEWSHIFT | S/N |
| 0 | 20060039 | 0.00224995 | 0.00000 | 17.0770 | 20060044 | -0.496669 | 0.498919 | 18.7674 |
| 1 | 20060035 | 0.00000 | 0.00224995 | 17.7261 | 20060045 | -0.496956 | 0.499206 | 18.8989 |
| 2 | 20060038 | 0.00184658 | 0.000403370 | 17.7045 | 20060037 | -0.500864 | 0.503114 | 18.8539 |
| 3 | 20060043 | -0.000887412 | 0.00313736 | 17.2715 | 20060041 | -0.493644 | 0.495894 | 18.8201 |
| 4 | 20060042 | -0.00116730 | 0.00341725 | 14.8037 | 20060036 | -0.500597 | 0.502847 | 18.5872 |