| Red | Green | Blue | |
| z | 17.64 | ||
| znorm | Inf | ||
| sky | -Inf | -Inf | -Inf |
| S/N | 28.6 | 50.7 | 55.2 |
| S/N(c) | 0.0 | 0.0 | 0.0 |
| SN(E/C) |
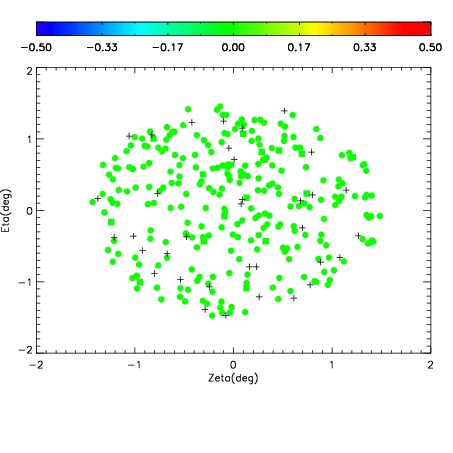
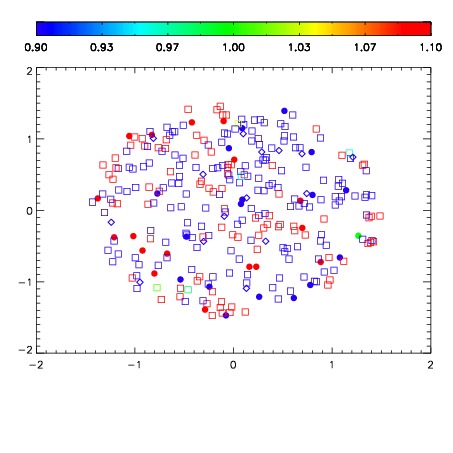
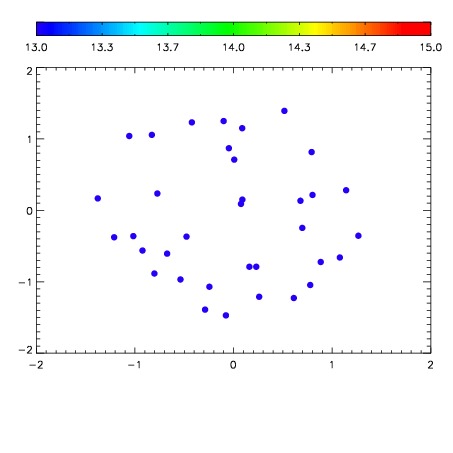

| Frame | Nreads | Zeropoints | Mag plots | Spatial mag deviation | Spatial sky 16325A emission deviations (filled: sky, open: star) | Spatial sky continuum emission | Spatial sky telluric CO2 absorption deviations (filled: H < 10) | |||||||||||||||||||||||
| 0 | 0 |
|
|
|
|
|
|
| IPAIR | NAME | SHIFT | NEWSHIFT | S/N | NAME | SHIFT | NEWSHIFT | S/N |
| 0 | 17850020 | 0.514608 | 0.00000 | 19.0809 | 17850011 | 0.00000 | 0.514608 | 19.0634 |
| 1 | 17850017 | 0.513801 | 0.000807047 | 19.0364 | 17850015 | 0.00209809 | 0.512510 | 19.0510 |
| 2 | 17850012 | 0.512604 | 0.00200403 | 19.0346 | 17850019 | 0.00691805 | 0.507690 | 19.0464 |
| 3 | 17850016 | 0.513548 | 0.00106001 | 19.0042 | 17850018 | 0.00677237 | 0.507836 | 19.0420 |
| 4 | 17850013 | 0.513727 | 0.000881016 | 18.9324 | 17850014 | 0.00222010 | 0.512388 | 18.9504 |