| Red | Green | Blue | |
| z | 17.64 | ||
| znorm | Inf | ||
| sky | -Inf | -Inf | -NaN |
| S/N | 28.0 | 45.7 | 56.2 |
| S/N(c) | 0.0 | 0.0 | 0.0 |
| SN(E/C) |
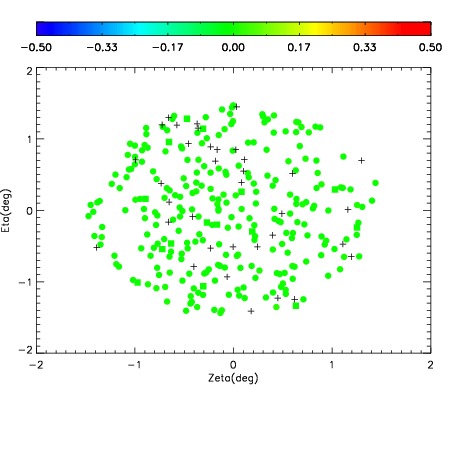
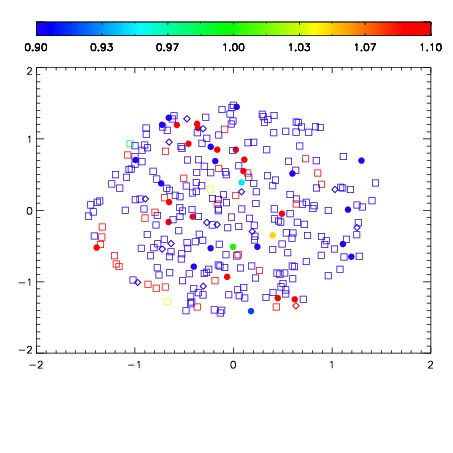
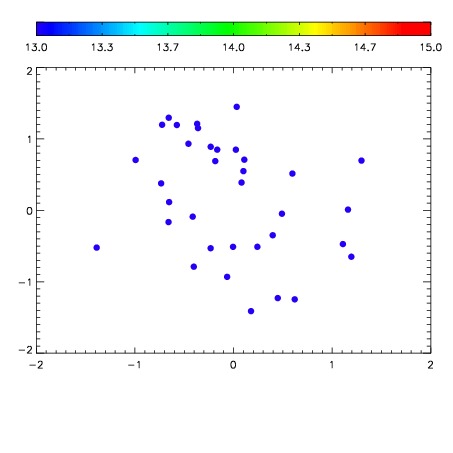

| Frame | Nreads | Zeropoints | Mag plots | Spatial mag deviation | Spatial sky 16325A emission deviations (filled: sky, open: star) | Spatial sky continuum emission | Spatial sky telluric CO2 absorption deviations (filled: H < 10) | |||||||||||||||||||||||
| 0 | 0 |
|
|
|
|
|
|
| IPAIR | NAME | SHIFT | NEWSHIFT | S/N | NAME | SHIFT | NEWSHIFT | S/N |
| 0 | 17620039 | 0.500887 | 0.00000 | 18.1183 | 17620038 | 0.00417667 | 0.496710 | 18.4762 |
| 1 | 17620044 | 0.497125 | 0.00376198 | 19.0514 | 17620037 | 0.00363927 | 0.497248 | 19.0662 |
| 2 | 17620035 | 0.497857 | 0.00302997 | 19.0067 | 17620042 | -0.00199418 | 0.502881 | 18.9664 |
| 3 | 17620043 | 0.497536 | 0.00335097 | 18.9682 | 17620041 | -0.00211181 | 0.502999 | 18.8764 |
| 4 | 17620036 | 0.498842 | 0.00204498 | 18.8656 | 17620034 | 0.00000 | 0.500887 | 18.8705 |
| 5 | 17620040 | 0.500276 | 0.000610948 | 18.2884 | 17620045 | 0.000668549 | 0.500218 | 18.8646 |