| Red | Green | Blue | |
| z | 17.64 | ||
| znorm | Inf | ||
| sky | -Inf | -Inf | -Inf |
| S/N | 20.1 | 37.9 | 40.1 |
| S/N(c) | 0.0 | 0.0 | 0.0 |
| SN(E/C) |
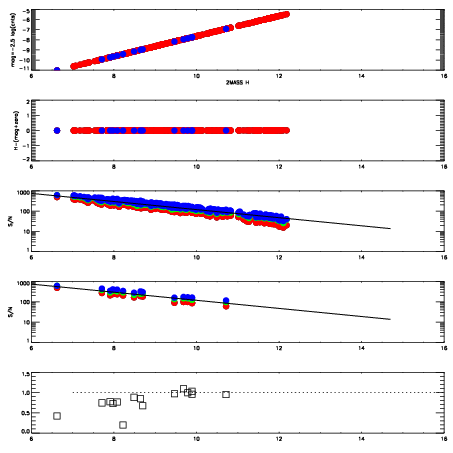
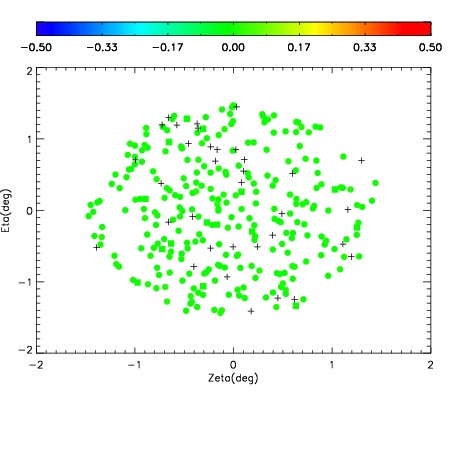
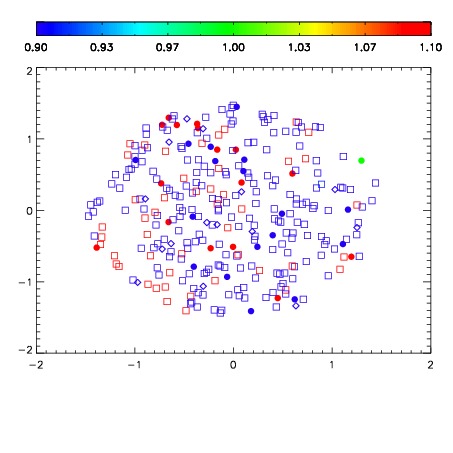
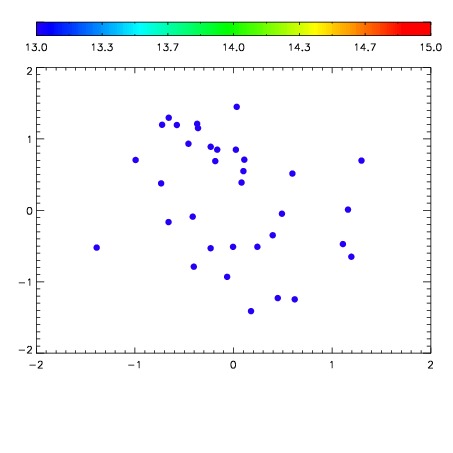

| Frame | Nreads | Zeropoints | Mag plots | Spatial mag deviation | Spatial sky 16325A emission deviations (filled: sky, open: star) | Spatial sky continuum emission | Spatial sky telluric CO2 absorption deviations (filled: H < 10) | |||||||||||||||||||||||
| 0 | 0 |
|
|
|
|
|
|
| IPAIR | NAME | SHIFT | NEWSHIFT | S/N | NAME | SHIFT | NEWSHIFT | S/N |
| 0 | 17660049 | 0.504459 | 0.00000 | 18.7930 | 17660054 | 0.00425192 | 0.500207 | 18.7880 |
| 1 | 17660048 | 0.503298 | 0.00116104 | 18.8670 | 17660051 | 0.00414619 | 0.500313 | 18.8588 |
| 2 | 17660052 | 0.502487 | 0.00197202 | 18.8587 | 17660050 | 0.00392817 | 0.500531 | 18.8214 |
| 3 | 17660053 | 0.503187 | 0.00127202 | 18.8372 | 17660047 | 0.00000 | 0.504459 | 18.8006 |