| Red | Green | Blue | |
| z | 17.64 | ||
| znorm | Inf | ||
| sky | -Inf | -Inf | -Inf |
| S/N | 31.9 | 52.1 | 62.6 |
| S/N(c) | 0.0 | 0.0 | 0.0 |
| SN(E/C) |
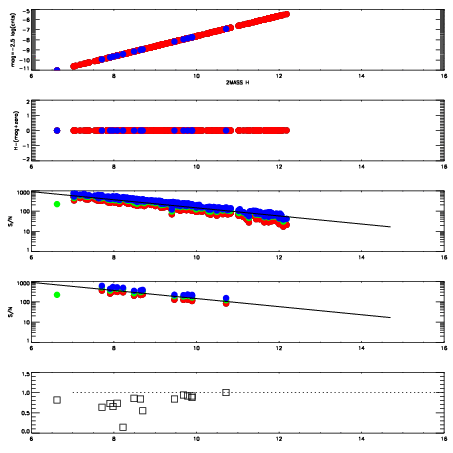
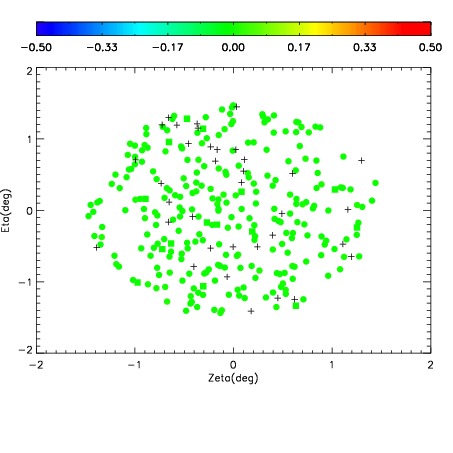
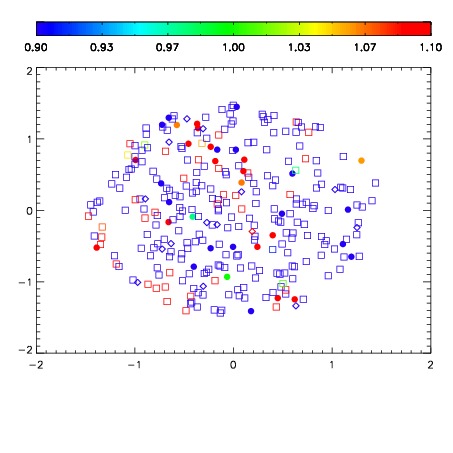
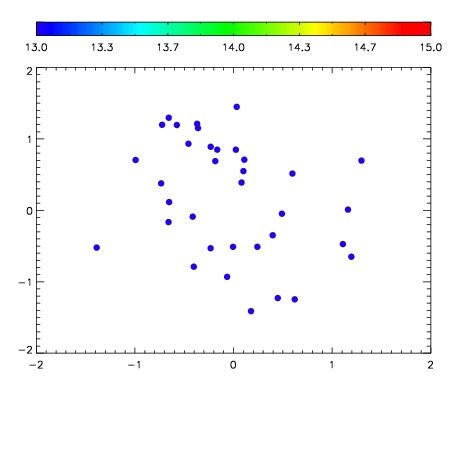

| Frame | Nreads | Zeropoints | Mag plots | Spatial mag deviation | Spatial sky 16325A emission deviations (filled: sky, open: star) | Spatial sky continuum emission | Spatial sky telluric CO2 absorption deviations (filled: H < 10) | |||||||||||||||||||||||
| 0 | 0 |
|
|
|
|
|
|
| IPAIR | NAME | SHIFT | NEWSHIFT | S/N | NAME | SHIFT | NEWSHIFT | S/N |
| 0 | 17880069 | 0.506023 | 0.00000 | 19.0192 | 17880059 | 0.00000 | 0.506023 | 19.0028 |
| 1 | 17880065 | 0.505817 | 0.000205994 | 19.1066 | 17880066 | 0.00414874 | 0.501874 | 19.1208 |
| 2 | 17880068 | 0.504976 | 0.00104702 | 19.0639 | 17880070 | 0.00634286 | 0.499680 | 19.0286 |
| 3 | 17880061 | 0.505766 | 0.000257015 | 18.9740 | 17880062 | 0.00342441 | 0.502599 | 18.9968 |
| 4 | 17880064 | 0.504826 | 0.00119698 | 18.9217 | 17880067 | 0.00388908 | 0.502134 | 18.9715 |
| 5 | 17880060 | 0.505155 | 0.000867963 | 18.8290 | 17880063 | 0.00332931 | 0.502694 | 18.9637 |