| Red | Green | Blue | |
| z | 17.64 | ||
| znorm | Inf | ||
| sky | -Inf | -Inf | -NaN |
| S/N | 11.7 | 19.8 | 23.2 |
| S/N(c) | 0.0 | 0.0 | 0.0 |
| SN(E/C) |
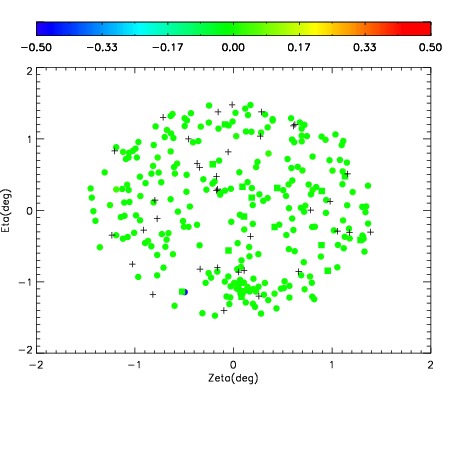
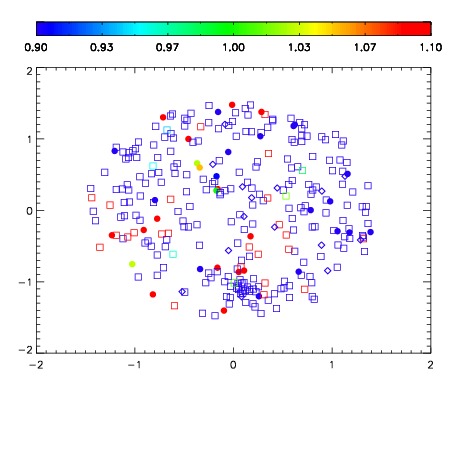
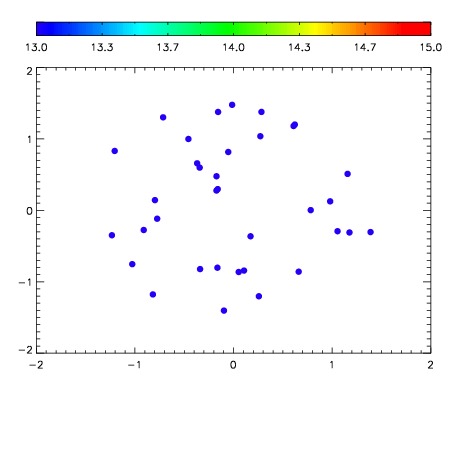

| Frame | Nreads | Zeropoints | Mag plots | Spatial mag deviation | Spatial sky 16325A emission deviations (filled: sky, open: star) | Spatial sky continuum emission | Spatial sky telluric CO2 absorption deviations (filled: H < 10) | |||||||||||||||||||||||
| 0 | 0 |
|
|
|
|
|
|
| IPAIR | NAME | SHIFT | NEWSHIFT | S/N | NAME | SHIFT | NEWSHIFT | S/N |
| 0 | 17590072 | 0.506810 | 0.00000 | 17.5665 | 17590069 | 0.00451943 | 0.502291 | 17.3771 |
| 1 | 17590071 | 0.505412 | 0.00139803 | 17.9385 | 17590066 | 0.00000 | 0.506810 | 18.8406 |
| 2 | 17590067 | 0.504110 | 0.00270003 | 17.8178 | 17590073 | 0.00608060 | 0.500729 | 18.2316 |
| 3 | 17590068 | 0.504591 | 0.00221902 | 17.6696 | 17590070 | 0.00476131 | 0.502049 | 17.8584 |