| Red | Green | Blue | |
| z | 17.64 | ||
| znorm | Inf | ||
| sky | -Inf | -Inf | -Inf |
| S/N | 23.6 | 40.1 | 46.0 |
| S/N(c) | 0.0 | 0.0 | 0.0 |
| SN(E/C) |
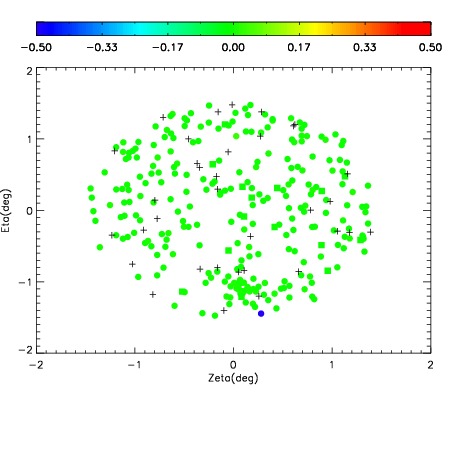
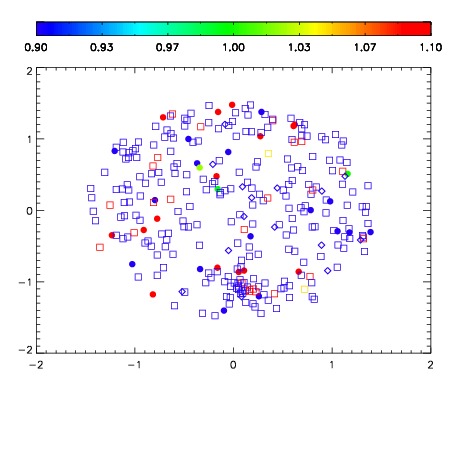
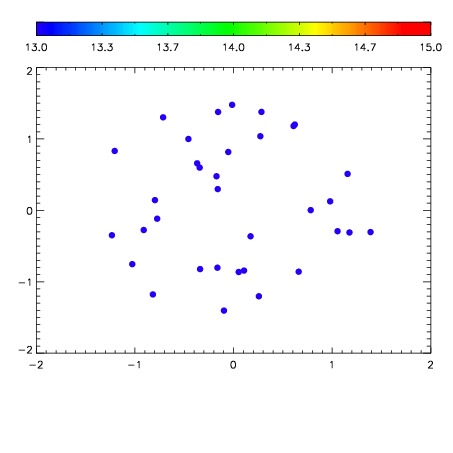

| Frame | Nreads | Zeropoints | Mag plots | Spatial mag deviation | Spatial sky 16325A emission deviations (filled: sky, open: star) | Spatial sky continuum emission | Spatial sky telluric CO2 absorption deviations (filled: H < 10) | |||||||||||||||||||||||
| 0 | 0 |
|
|
|
|
|
|
| IPAIR | NAME | SHIFT | NEWSHIFT | S/N | NAME | SHIFT | NEWSHIFT | S/N |
| 0 | 17620029 | 0.501563 | 0.00000 | 18.8950 | 17620023 | 0.00000 | 0.501563 | 19.0716 |
| 1 | 17620025 | 0.501304 | 0.000259042 | 18.7391 | 17620026 | 0.00100658 | 0.500556 | 18.7989 |
| 2 | 17620024 | 0.501097 | 0.000465989 | 18.7300 | 17620027 | 0.000761140 | 0.500802 | 18.7738 |
| 3 | 17620028 | 0.501472 | 9.10163e-05 | 18.6980 | 17620030 | 0.00427262 | 0.497290 | 18.7734 |