| Red | Green | Blue | |
| z | 17.64 | ||
| znorm | Inf | ||
| sky | -Inf | -Inf | -Inf |
| S/N | 26.2 | 42.9 | 51.6 |
| S/N(c) | 0.0 | 0.0 | 0.0 |
| SN(E/C) |
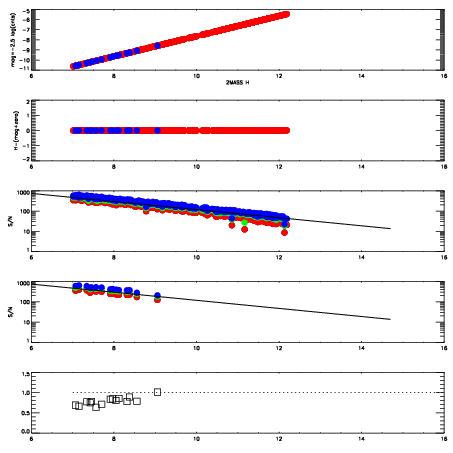
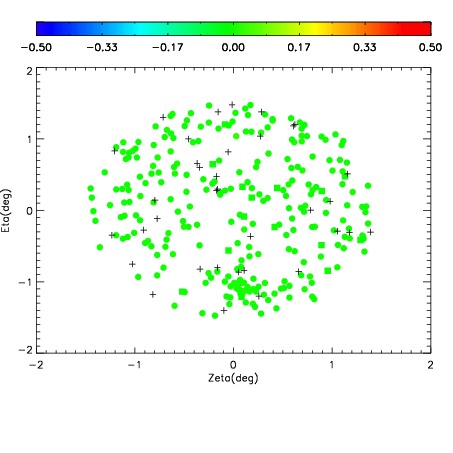
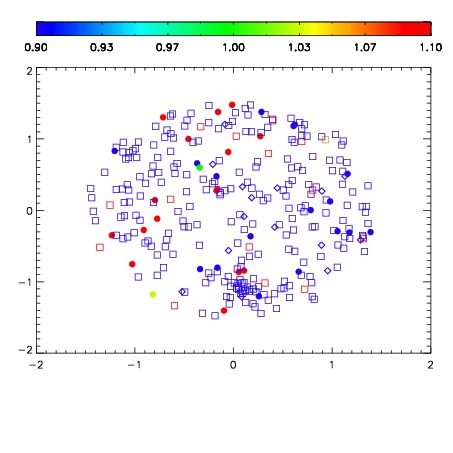
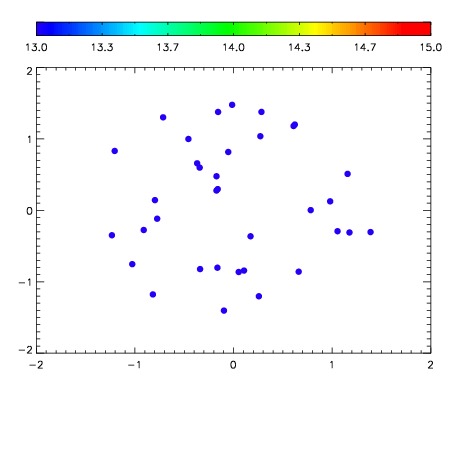

| Frame | Nreads | Zeropoints | Mag plots | Spatial mag deviation | Spatial sky 16325A emission deviations (filled: sky, open: star) | Spatial sky continuum emission | Spatial sky telluric CO2 absorption deviations (filled: H < 10) | |||||||||||||||||||||||
| 0 | 0 |
|
|
|
|
|
|
| IPAIR | NAME | SHIFT | NEWSHIFT | S/N | NAME | SHIFT | NEWSHIFT | S/N |
| 0 | 17850050 | 0.514100 | 0.00000 | 19.0963 | 17850051 | 0.00248413 | 0.511616 | 19.0130 |
| 1 | 17850049 | 0.513791 | 0.000308990 | 19.0429 | 17850048 | 0.00000 | 0.514100 | 18.9971 |
| 2 | 17850054 | 0.513516 | 0.000584006 | 18.8398 | 17850055 | 0.00809246 | 0.506008 | 18.9136 |
| 3 | 17850053 | 0.513347 | 0.000752985 | 18.7784 | 17850052 | 0.00235367 | 0.511746 | 18.8005 |