| Red | Green | Blue | |
| z | 17.64 | ||
| znorm | Inf | ||
| sky | -Inf | -Inf | -Inf |
| S/N | 26.7 | 42.1 | 52.2 |
| S/N(c) | 0.0 | 0.0 | 0.0 |
| SN(E/C) |
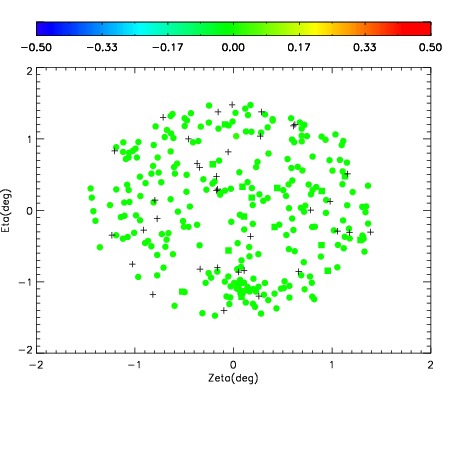
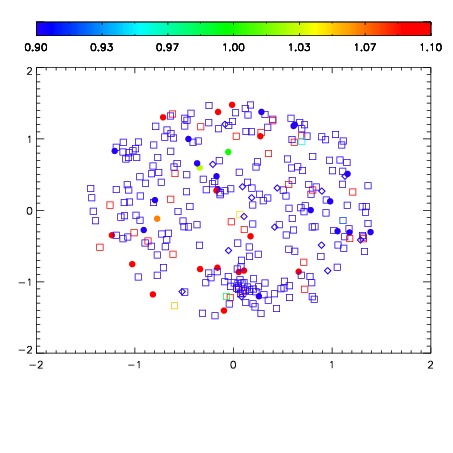
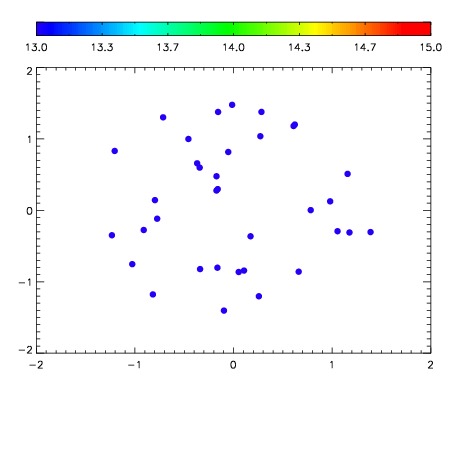

| Frame | Nreads | Zeropoints | Mag plots | Spatial mag deviation | Spatial sky 16325A emission deviations (filled: sky, open: star) | Spatial sky continuum emission | Spatial sky telluric CO2 absorption deviations (filled: H < 10) | |||||||||||||||||||||||
| 0 | 0 |
|
|
|
|
|
|
| IPAIR | NAME | SHIFT | NEWSHIFT | S/N | NAME | SHIFT | NEWSHIFT | S/N |
| 0 | 17880039 | 0.507204 | 0.00000 | 19.0730 | 17880040 | 0.00233367 | 0.504870 | 19.0893 |
| 1 | 17880038 | 0.506754 | 0.000450015 | 19.0769 | 17880044 | 0.00238752 | 0.504816 | 19.1201 |
| 2 | 17880043 | 0.505779 | 0.00142497 | 19.0705 | 17880037 | 0.00000 | 0.507204 | 19.0350 |
| 3 | 17880042 | 0.505645 | 0.00155902 | 18.9310 | 17880041 | 0.00188617 | 0.505318 | 18.8550 |