| Red | Green | Blue | |
| z | 17.64 | ||
| znorm | Inf | ||
| sky | -Inf | -Inf | -Inf |
| S/N | 31.5 | 53.4 | 64.4 |
| S/N(c) | 0.0 | 0.0 | 0.0 |
| SN(E/C) |
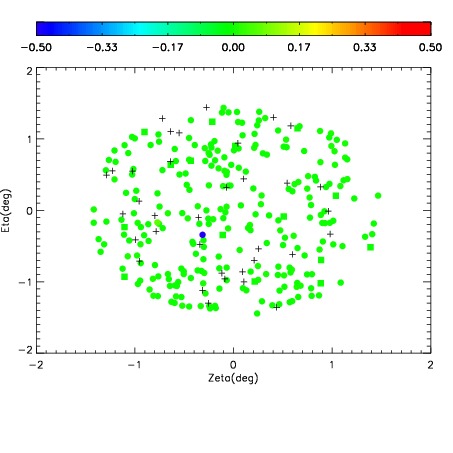
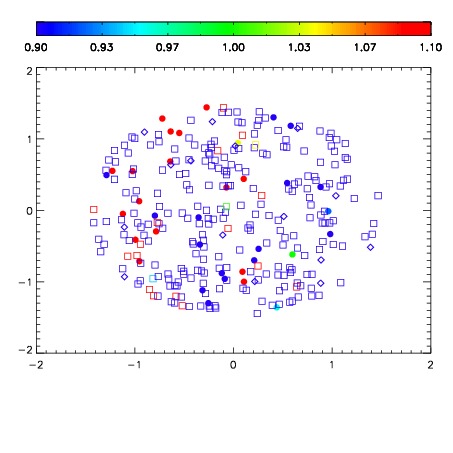
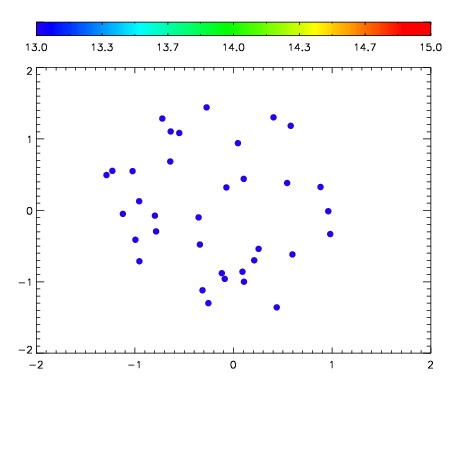

| Frame | Nreads | Zeropoints | Mag plots | Spatial mag deviation | Spatial sky 16325A emission deviations (filled: sky, open: star) | Spatial sky continuum emission | Spatial sky telluric CO2 absorption deviations (filled: H < 10) | |||||||||||||||||||||||
| 0 | 0 |
|
|
|
|
|
|
| IPAIR | NAME | SHIFT | NEWSHIFT | S/N | NAME | SHIFT | NEWSHIFT | S/N |
| 0 | 17600081 | 0.000501073 | 0.00000 | 19.0445 | 17600080 | -0.503990 | 0.504491 | 18.9549 |
| 1 | 17600086 | -0.000125227 | 0.000626300 | 19.1654 | 17600087 | -0.505558 | 0.506059 | 19.1763 |
| 2 | 17600085 | -0.000248370 | 0.000749443 | 19.1499 | 17600084 | -0.504736 | 0.505237 | 19.1290 |
| 3 | 17600082 | 0.000215482 | 0.000285591 | 19.1337 | 17600083 | -0.503951 | 0.504452 | 19.1248 |
| 4 | 17600078 | 0.00000 | 0.000501073 | 18.8631 | 17600079 | -0.503663 | 0.504164 | 18.7920 |