| Red | Green | Blue | |
| z | 17.64 | ||
| znorm | Inf | ||
| sky | -Inf | -NaN | -NaN |
| S/N | 27.0 | 47.7 | 54.2 |
| S/N(c) | 0.0 | 0.0 | 0.0 |
| SN(E/C) |
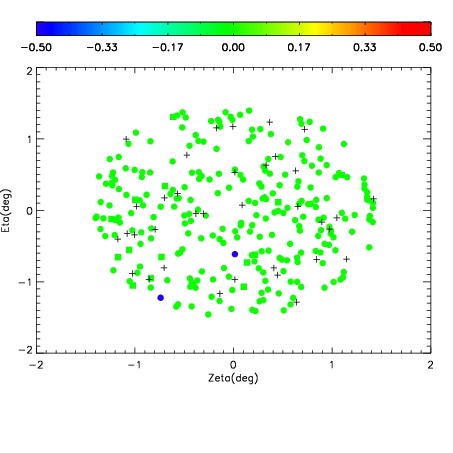
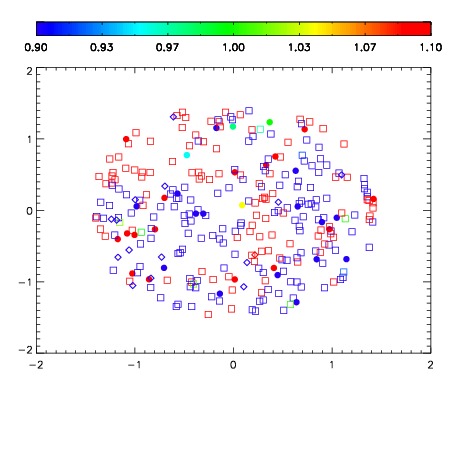
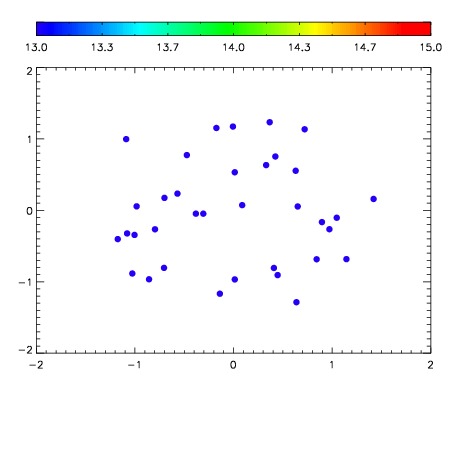

| Frame | Nreads | Zeropoints | Mag plots | Spatial mag deviation | Spatial sky 16325A emission deviations (filled: sky, open: star) | Spatial sky continuum emission | Spatial sky telluric CO2 absorption deviations (filled: H < 10) | |||||||||||||||||||||||
| 0 | 0 |
|
|
|
|
|
|
| IPAIR | NAME | SHIFT | NEWSHIFT | S/N | NAME | SHIFT | NEWSHIFT | S/N |
| 0 | 18460017 | 0.499694 | 0.00000 | 18.8250 | 18460018 | 0.000111191 | 0.499583 | 18.7884 |
| 1 | 18460012 | 0.495139 | 0.00455499 | 18.7494 | 18460019 | -0.000565494 | 0.500259 | 18.7628 |
| 2 | 18460013 | 0.495905 | 0.00378898 | 18.7432 | 18460015 | 0.00317016 | 0.496524 | 18.7621 |
| 3 | 18460016 | 0.499224 | 0.000469983 | 18.6628 | 18460022 | -0.00232029 | 0.502014 | 18.7434 |
| 4 | 18460021 | 0.498207 | 0.00148699 | 18.6385 | 18460011 | 0.00000 | 0.499694 | 18.7323 |
| 5 | 18460020 | 0.497611 | 0.00208300 | 18.5696 | 18460014 | 0.00323209 | 0.496462 | 18.7310 |