| Red | Green | Blue | |
| z | 17.64 | ||
| znorm | Inf | ||
| sky | -Inf | -Inf | -Inf |
| S/N | 29.8 | 51.8 | 59.8 |
| S/N(c) | 0.0 | 0.0 | 0.0 |
| SN(E/C) |
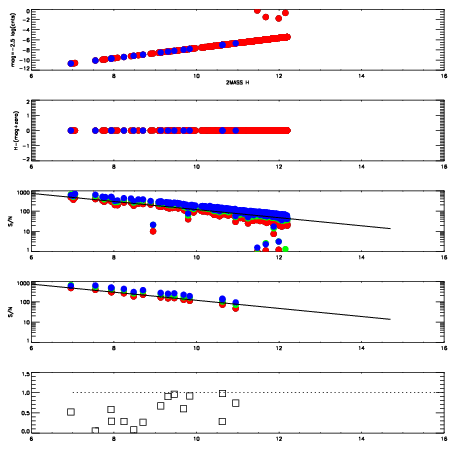
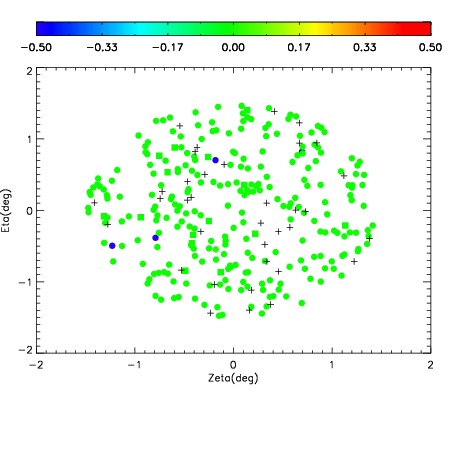
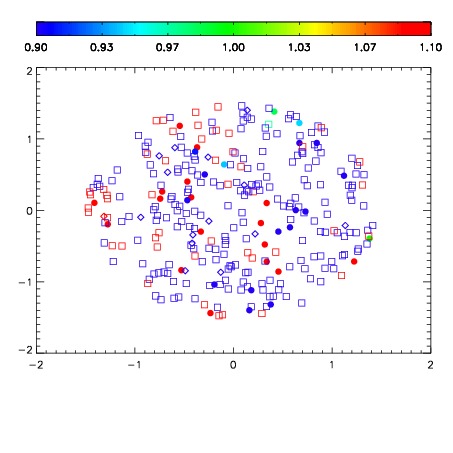
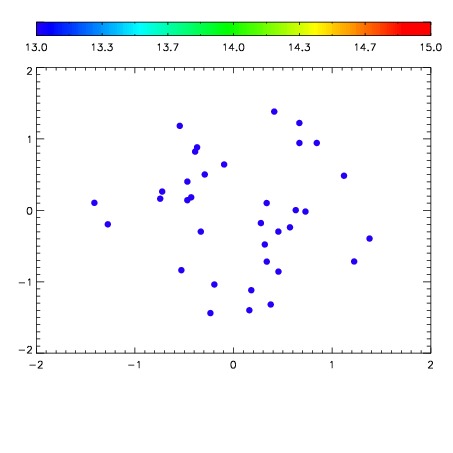

| Frame | Nreads | Zeropoints | Mag plots | Spatial mag deviation | Spatial sky 16325A emission deviations (filled: sky, open: star) | Spatial sky continuum emission | Spatial sky telluric CO2 absorption deviations (filled: H < 10) | |||||||||||||||||||||||
| 0 | 0 |
|
|
|
|
|
|
| IPAIR | NAME | SHIFT | NEWSHIFT | S/N | NAME | SHIFT | NEWSHIFT | S/N |
| 0 | 17670055 | 0.507082 | 0.00000 | 19.2159 | 17670049 | 0.00000 | 0.507082 | 19.1778 |
| 1 | 17670050 | 0.505817 | 0.00126499 | 19.2296 | 17670056 | 0.00521686 | 0.501865 | 19.2259 |
| 2 | 17670051 | 0.506529 | 0.000553012 | 19.2244 | 17670053 | 0.00295685 | 0.504125 | 19.1951 |
| 3 | 17670054 | 0.506620 | 0.000461996 | 19.2215 | 17670052 | 0.00268327 | 0.504399 | 19.1842 |