| Red | Green | Blue | |
| z | 17.63 | ||
| znorm | Inf | ||
| sky | -Inf | -NaN | -NaN |
| S/N | 26.7 | 48.0 | 53.2 |
| S/N(c) | 0.0 | 0.0 | 0.0 |
| SN(E/C) |
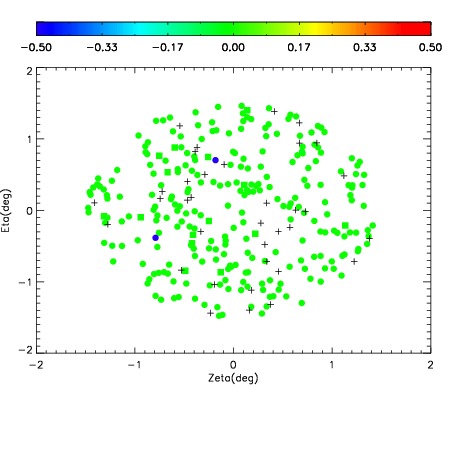
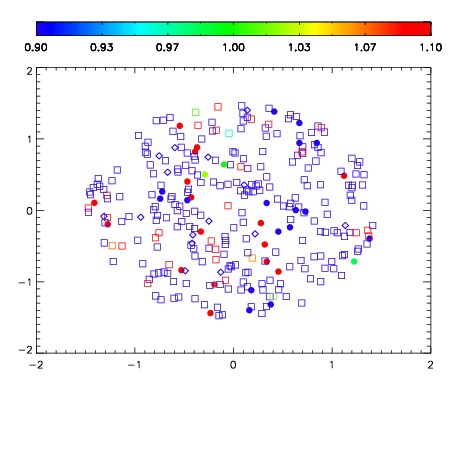


| Frame | Nreads | Zeropoints | Mag plots | Spatial mag deviation | Spatial sky 16325A emission deviations (filled: sky, open: star) | Spatial sky continuum emission | Spatial sky telluric CO2 absorption deviations (filled: H < 10) | |||||||||||||||||||||||
| 0 | 0 |
|
|
|
|
|
|
| IPAIR | NAME | SHIFT | NEWSHIFT | S/N | NAME | SHIFT | NEWSHIFT | S/N |
| 0 | 17960017 | 0.504082 | 0.00000 | 19.0615 | 17960018 | 0.00115451 | 0.502928 | 18.9988 |
| 1 | 17960016 | 0.503052 | 0.00103003 | 19.0392 | 17960015 | -0.00118157 | 0.505264 | 18.9928 |
| 2 | 17960012 | 0.503086 | 0.000996053 | 18.9808 | 17960014 | -0.00164210 | 0.505724 | 18.9763 |
| 3 | 17960013 | 0.502962 | 0.00112003 | 18.9629 | 17960011 | 0.00000 | 0.504082 | 18.9650 |