| Red | Green | Blue | |
| z | 17.64 | ||
| znorm | Inf | ||
| sky | -Inf | -Inf | -Inf |
| S/N | 35.1 | 60.3 | 69.6 |
| S/N(c) | 0.0 | 0.0 | 0.0 |
| SN(E/C) |
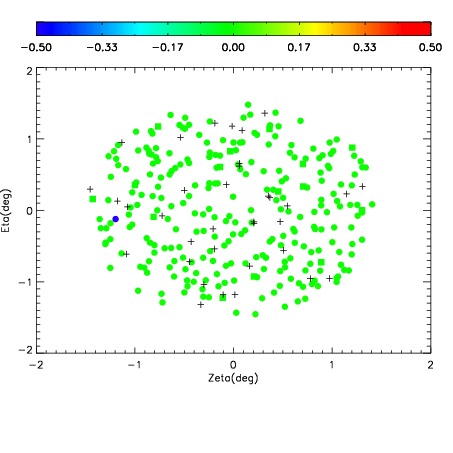
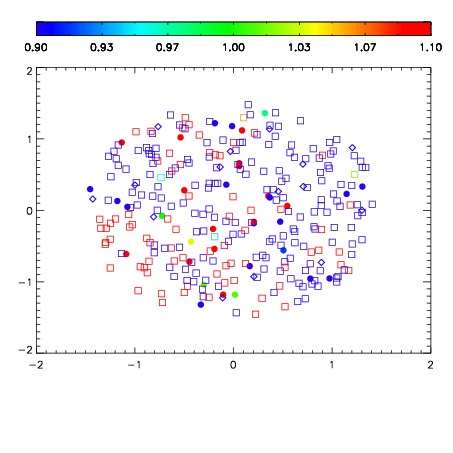
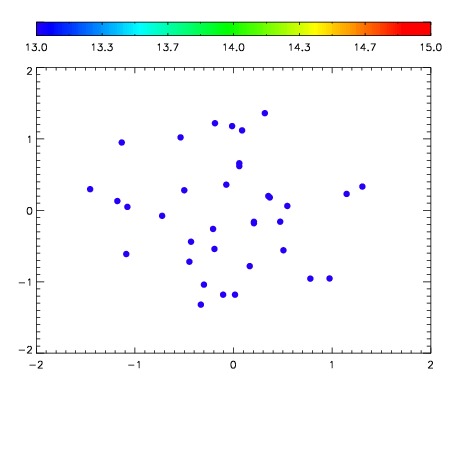

| Frame | Nreads | Zeropoints | Mag plots | Spatial mag deviation | Spatial sky 16325A emission deviations (filled: sky, open: star) | Spatial sky continuum emission | Spatial sky telluric CO2 absorption deviations (filled: H < 10) | |||||||||||||||||||||||
| 0 | 0 |
|
|
|
|
|
|
| IPAIR | NAME | SHIFT | NEWSHIFT | S/N | NAME | SHIFT | NEWSHIFT | S/N |
| 0 | 17870028 | 0.513035 | 0.00000 | 19.1088 | 17870022 | 0.00000 | 0.513035 | 19.0828 |
| 1 | 17870031 | 0.509425 | 0.00361001 | 19.1333 | 17870033 | 0.000147126 | 0.512888 | 19.1713 |
| 2 | 17870024 | 0.511454 | 0.00158101 | 19.1318 | 17870025 | 0.000489507 | 0.512545 | 19.1429 |
| 3 | 17870027 | 0.512723 | 0.000311971 | 19.1225 | 17870029 | 0.000635851 | 0.512399 | 19.1315 |
| 4 | 17870032 | 0.510197 | 0.00283802 | 19.1168 | 17870026 | 0.000499943 | 0.512535 | 19.1303 |
| 5 | 17870023 | 0.510836 | 0.00219899 | 19.1088 | 17870030 | 0.000465401 | 0.512570 | 19.1215 |