| Red | Green | Blue | |
| z | 17.64 | ||
| znorm | Inf | ||
| sky | -Inf | -Inf | -Inf |
| S/N | 27.1 | 45.3 | 53.3 |
| S/N(c) | 0.0 | 0.0 | 0.0 |
| SN(E/C) |
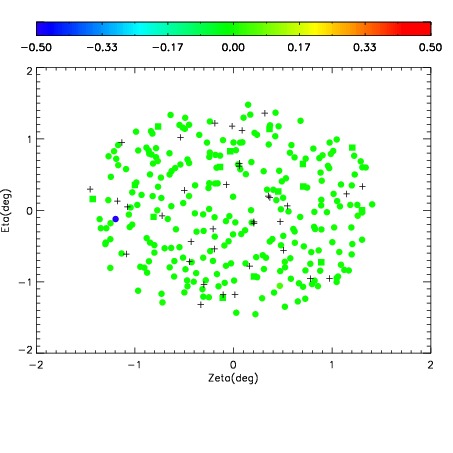
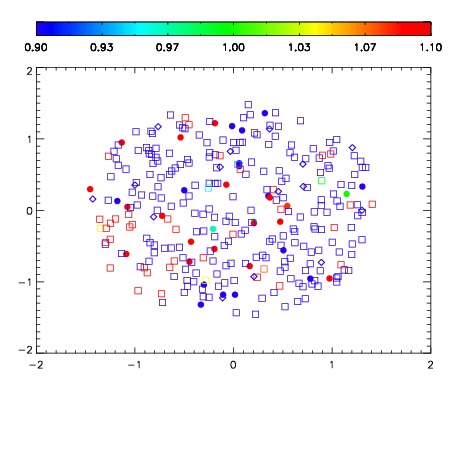
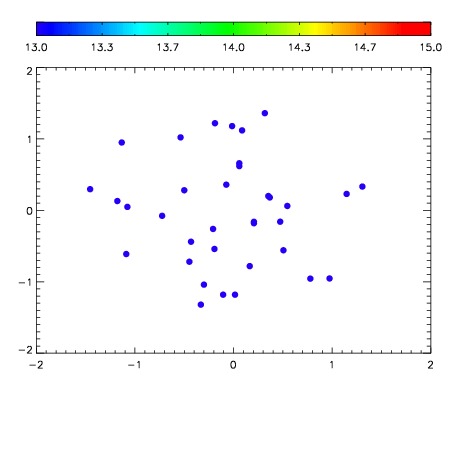

| Frame | Nreads | Zeropoints | Mag plots | Spatial mag deviation | Spatial sky 16325A emission deviations (filled: sky, open: star) | Spatial sky continuum emission | Spatial sky telluric CO2 absorption deviations (filled: H < 10) | |||||||||||||||||||||||
| 0 | 0 |
|
|
|
|
|
|
| IPAIR | NAME | SHIFT | NEWSHIFT | S/N | NAME | SHIFT | NEWSHIFT | S/N |
| 0 | 18130016 | 0.506164 | 0.00000 | 19.1772 | 18130011 | 0.00000 | 0.506164 | 19.1931 |
| 1 | 18130012 | 0.504653 | 0.00151104 | 19.2097 | 18130015 | 0.00221377 | 0.503950 | 19.2134 |
| 2 | 18130013 | 0.505198 | 0.000966012 | 19.1915 | 18130014 | 0.00225287 | 0.503911 | 19.2088 |