| Red | Green | Blue | |
| z | 17.64 | ||
| znorm | Inf | ||
| sky | -NaN | -NaN | -NaN |
| S/N | 23.8 | 41.6 | 46.7 |
| S/N(c) | 0.0 | 0.0 | 0.0 |
| SN(E/C) |
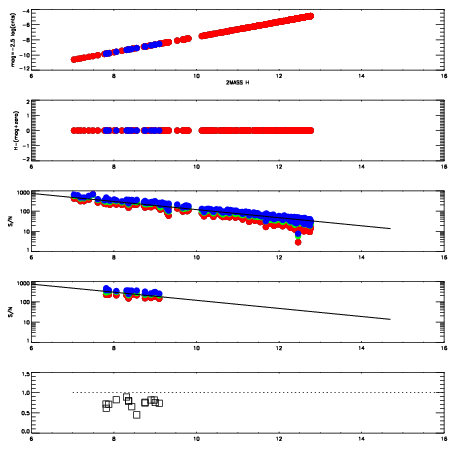
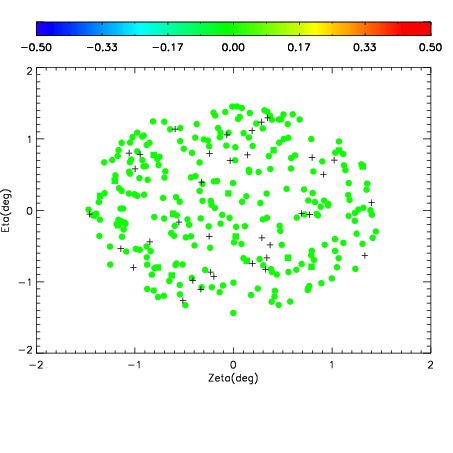
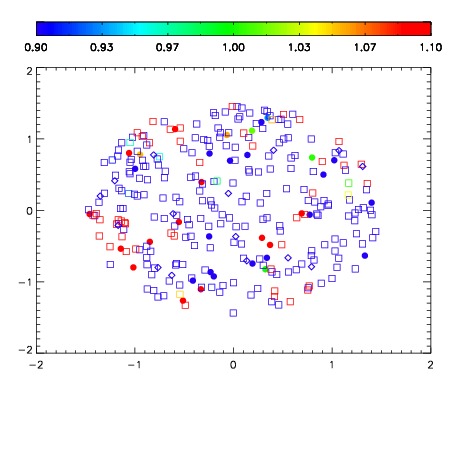
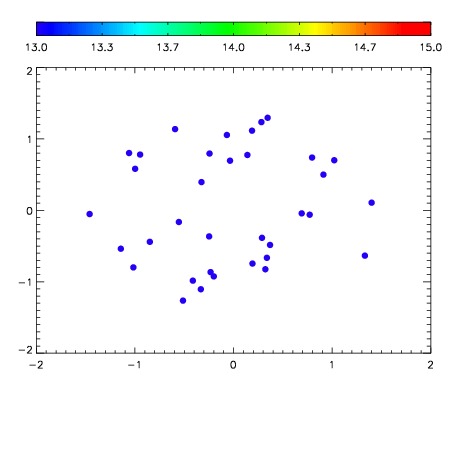

| Frame | Nreads | Zeropoints | Mag plots | Spatial mag deviation | Spatial sky 16325A emission deviations (filled: sky, open: star) | Spatial sky continuum emission | Spatial sky telluric CO2 absorption deviations (filled: H < 10) | |||||||||||||||||||||||
| 0 | 0 |
|
|
|
|
|
|
| IPAIR | NAME | SHIFT | NEWSHIFT | S/N | NAME | SHIFT | NEWSHIFT | S/N |
| 0 | 20030012 | 0.490679 | 0.00000 | 18.9157 | 20030013 | -0.00372557 | 0.494405 | 18.8370 |
| 1 | 20030015 | 0.489723 | 0.000955999 | 18.9931 | 20030017 | -0.00566937 | 0.496348 | 18.9836 |
| 2 | 20030016 | 0.490498 | 0.000180990 | 18.9317 | 20030014 | -0.00316301 | 0.493842 | 18.8794 |
| 3 | 20030011 | 0.490224 | 0.000454992 | 18.8312 | 20030010 | 0.00000 | 0.490679 | 18.7786 |