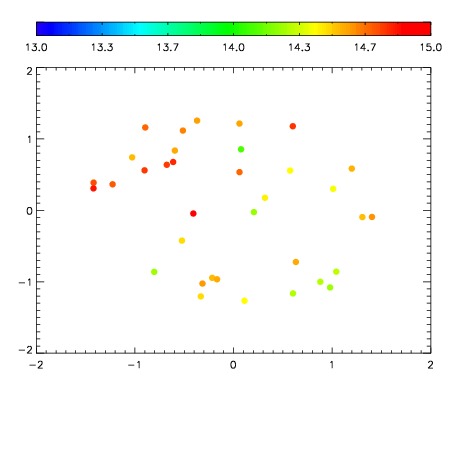
| Frame | Nreads | Zeropoints | Mag plots
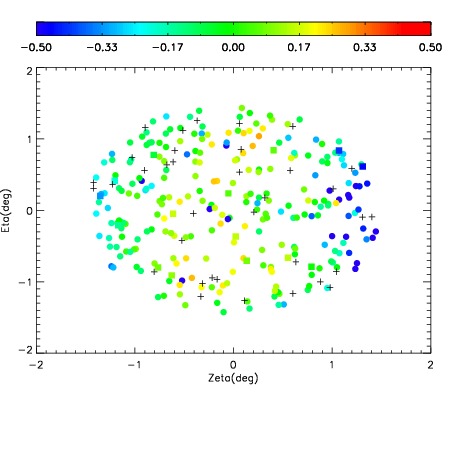
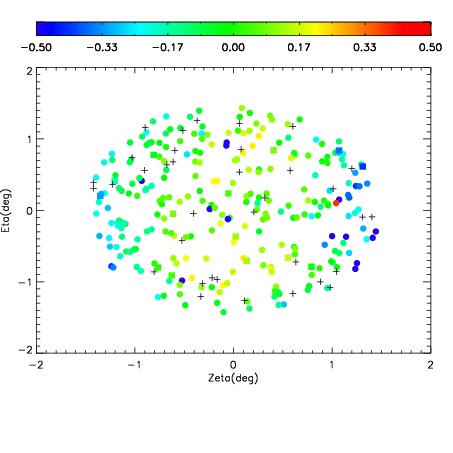
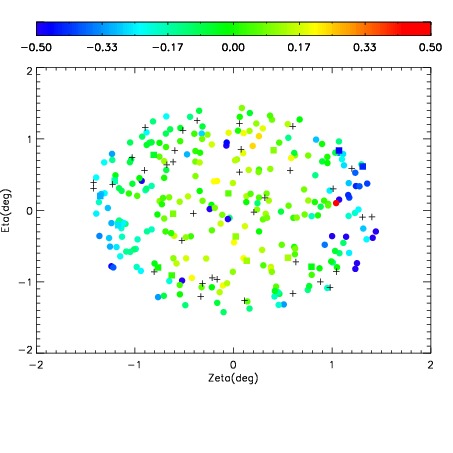
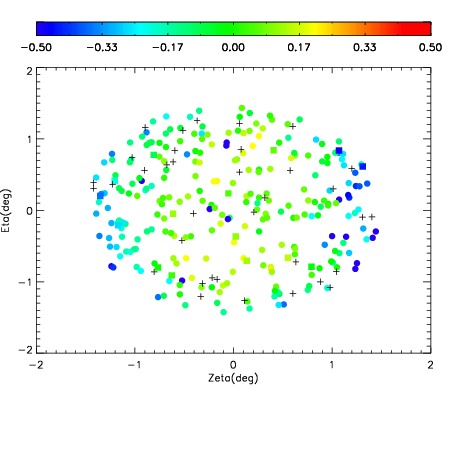
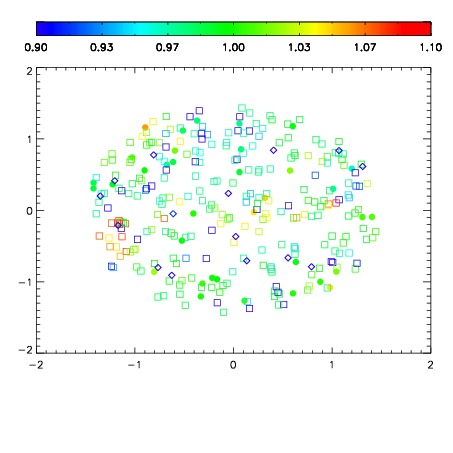
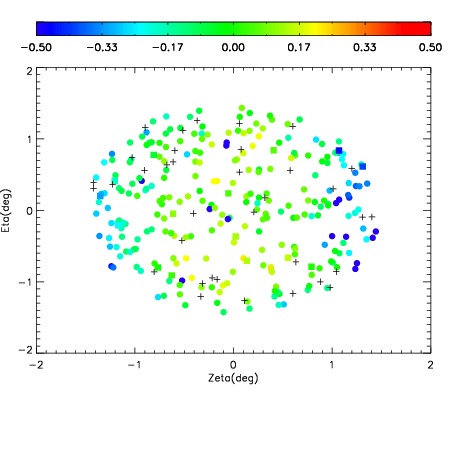
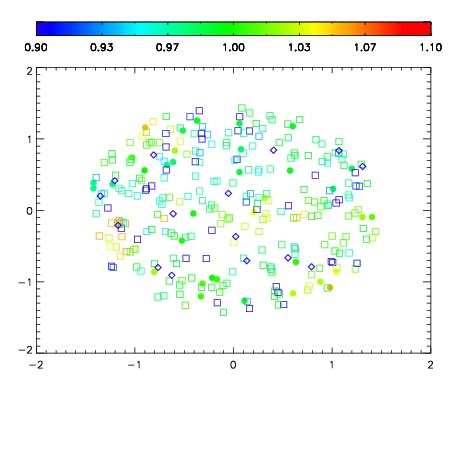
| Spatial mag deviation
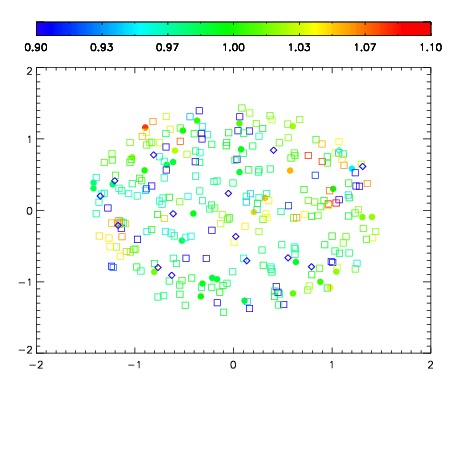
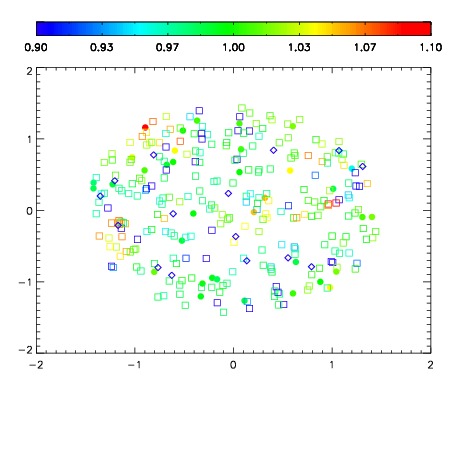
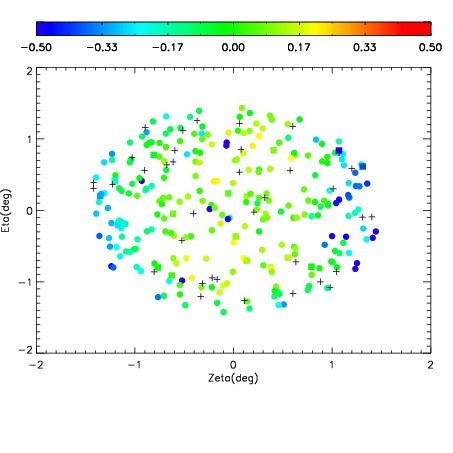
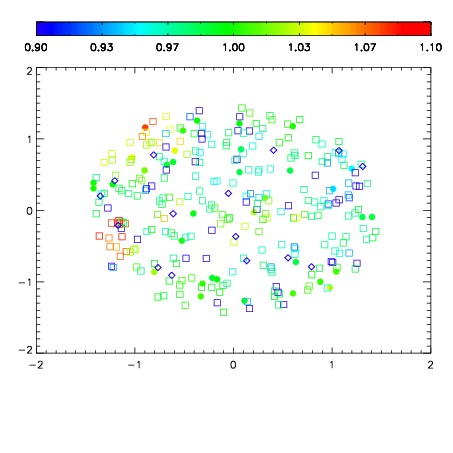
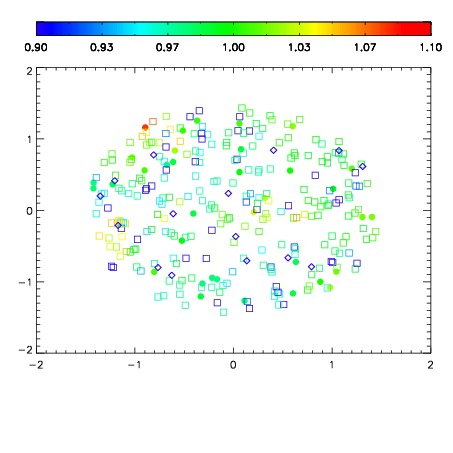
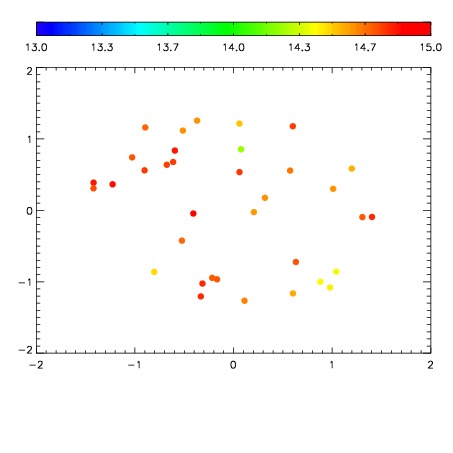
| Spatial sky 16325A emission deviations (filled: sky, open: star)
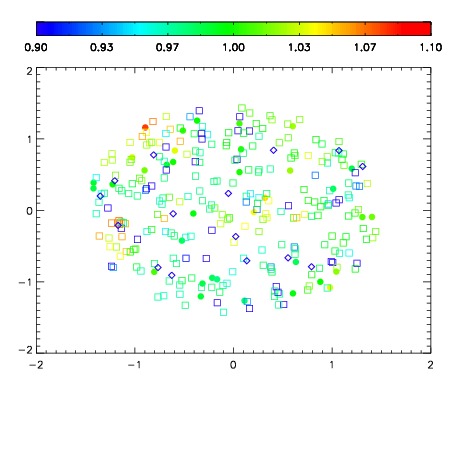
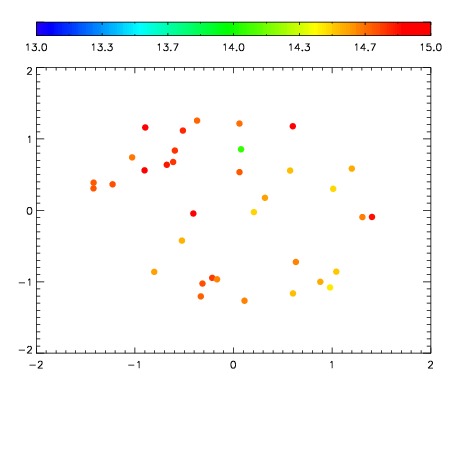
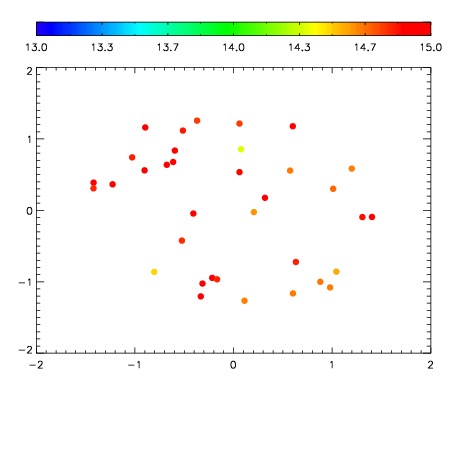
| Spatial sky continuum emission
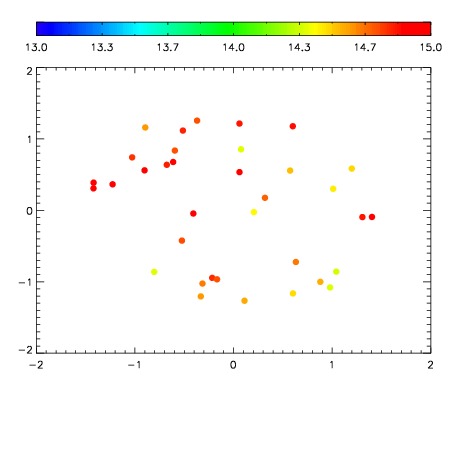
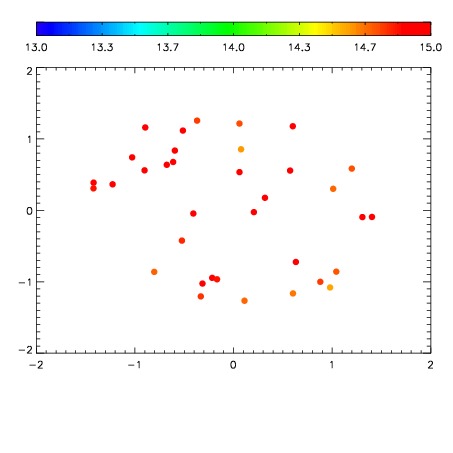
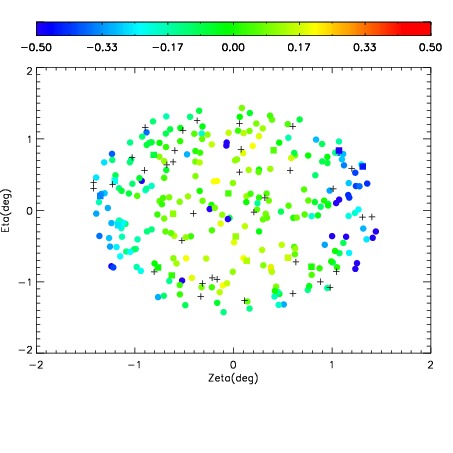
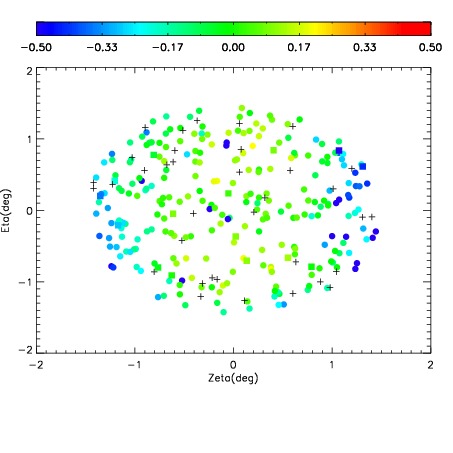
| Spatial sky telluric CO2 absorption deviations (filled: H < 10)
|
| 19730057
| 47
| | Red | Green | Blue
| | z | | 18.80
| | znorm | | 14.62
| | sky | 14.9 | 14.6 | 14.6
| | S/N | 13.0 | 21.5 | 23.7
| | S/N(c) | 18.0 | 39.0 | 48.9
| | SN(E/C) 0.94
|
| 
| 
| 
| 
| 
|
| 19730058
| 47
| | Red | Green | Blue
| | z | | 18.74
| | znorm | | 14.56
| | sky | 15.2 | 14.7 | 14.6
| | S/N | 12.8 | 21.3 | 23.1
| | S/N(c) | 17.7 | 38.3 | 48.5
| | SN(E/C) 0.92
|
| 
| 
| 
| 
| 
|
| 19730059
| 47
| | Red | Green | Blue
| | z | | 18.85
| | znorm | | 14.67
| | sky | 14.6 | 14.7 | 14.8
| | S/N | 13.7 | 22.9 | 24.9
| | S/N(c) | 18.8 | 40.1 | 51.4
| | SN(E/C) 0.90
|
| 
| 
| 
| 
| 
|
| 19730060
| 47
| | Red | Green | Blue
| | z | | 18.92
| | znorm | | 14.74
| | sky | 14.8 | 14.7 | 14.8
| | S/N | 13.9 | 23.6 | 25.7
| | S/N(c) | 19.6 | 41.6 | 53.1
| | SN(E/C) 0.91
|
| 
| 
| 
| 
| 
|
| 19730061
| 47
| | Red | Green | Blue
| | z | | 18.86
| | znorm | | 14.68
| | sky | 15.3 | 14.9 | 14.8
| | S/N | 13.8 | 23.0 | 25.0
| | S/N(c) | 19.2 | 41.1 | 51.7
| | SN(E/C) 0.93
|
| 
| 
| 
| 
| 
|
| 19730062
| 47
| | Red | Green | Blue
| | z | | 18.78
| | znorm | | 14.60
| | sky | 15.0 | 14.7 | 14.8
| | S/N | 13.1 | 21.8 | 24.2
| | S/N(c) | 18.5 | 39.2 | 49.7
| | SN(E/C) 0.93
|
| 
| 
| 
| 
| 
|
| 19730063
| 47
| | Red | Green | Blue
| | z | | 18.90
| | znorm | | 14.72
| | sky | 15.0 | 14.8 | 14.8
| | S/N | 13.7 | 23.1 | 25.3
| | S/N(c) | 19.7 | 41.7 | 52.8
| | SN(E/C) 0.89
|
| 
| 
| 
| 
| 
|
| 19730064
| 47
| | Red | Green | Blue
| | z | | 18.92
| | znorm | | 14.74
| | sky | 15.0 | 14.7 | 14.9
| | S/N | 14.1 | 23.3 | 25.9
| | S/N(c) | 20.0 | 42.1 | 53.7
| | SN(E/C) 0.85
|
| 
| 
| 
| 
| 
|