| Red | Green | Blue | |
| z | 17.64 | ||
| znorm | Inf | ||
| sky | -Inf | -Inf | -Inf |
| S/N | 24.1 | 41.8 | 47.4 |
| S/N(c) | 0.0 | 0.0 | 0.0 |
| SN(E/C) |
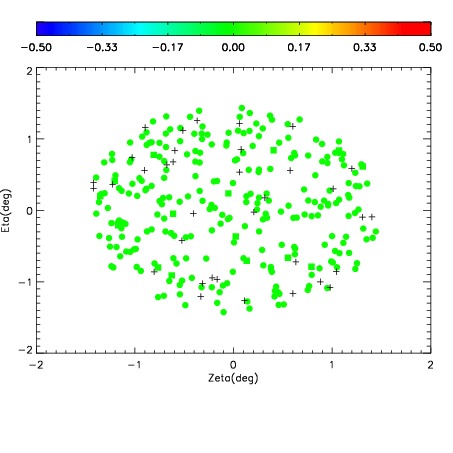
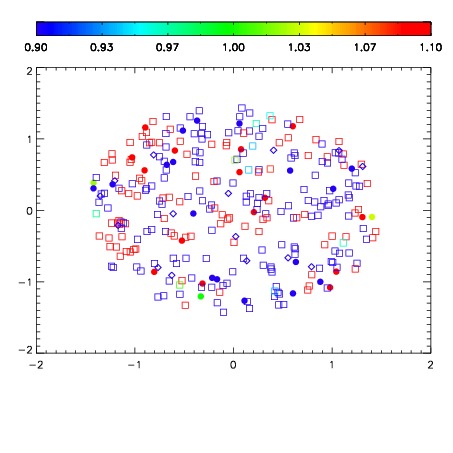
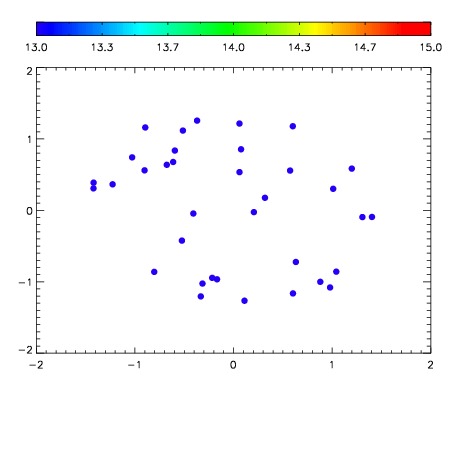

| Frame | Nreads | Zeropoints | Mag plots | Spatial mag deviation | Spatial sky 16325A emission deviations (filled: sky, open: star) | Spatial sky continuum emission | Spatial sky telluric CO2 absorption deviations (filled: H < 10) | |||||||||||||||||||||||
| 0 | 0 |
|
|
|
|
|
|
| IPAIR | NAME | SHIFT | NEWSHIFT | S/N | NAME | SHIFT | NEWSHIFT | S/N |
| 0 | 19730059 | 0.500405 | 0.00000 | 18.8180 | 19730060 | 0.00193129 | 0.498474 | 18.8776 |
| 1 | 19730063 | 0.497899 | 0.00250602 | 18.8598 | 19730064 | 0.00317323 | 0.497232 | 18.8799 |
| 2 | 19730062 | 0.497507 | 0.00289801 | 18.7400 | 19730061 | 0.00239736 | 0.498008 | 18.8244 |
| 3 | 19730058 | 0.499841 | 0.000564009 | 18.7106 | 19730057 | 0.00000 | 0.500405 | 18.7689 |