| Red | Green | Blue | |
| z | 17.64 | ||
| znorm | Inf | ||
| sky | -Inf | -Inf | -NaN |
| S/N | 23.4 | 41.9 | 46.5 |
| S/N(c) | 0.0 | 0.0 | 0.0 |
| SN(E/C) |
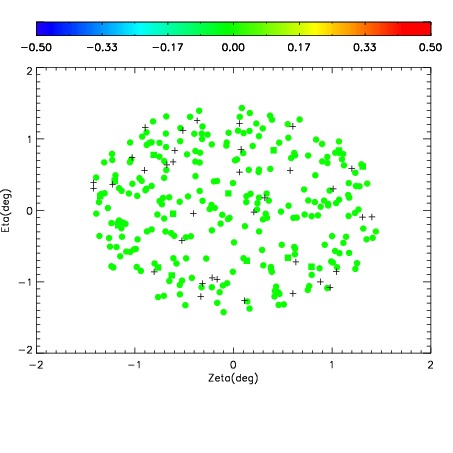
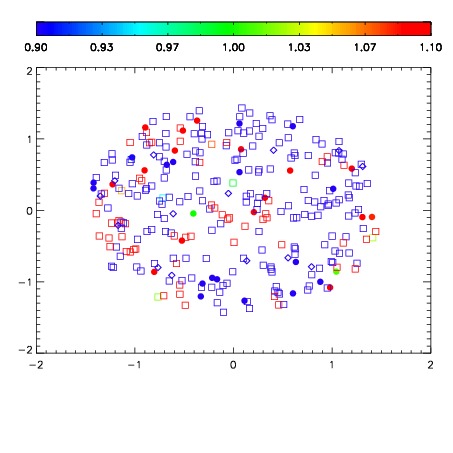


| Frame | Nreads | Zeropoints | Mag plots | Spatial mag deviation | Spatial sky 16325A emission deviations (filled: sky, open: star) | Spatial sky continuum emission | Spatial sky telluric CO2 absorption deviations (filled: H < 10) | |||||||||||||||||||||||
| 0 | 0 |
|
|
|
|
|
|
| IPAIR | NAME | SHIFT | NEWSHIFT | S/N | NAME | SHIFT | NEWSHIFT | S/N |
| 0 | 19960055 | 0.00170349 | 0.00000 | 18.6404 | 19960053 | -0.493713 | 0.495416 | 18.7496 |
| 1 | 19960051 | 0.000738238 | 0.000965252 | 18.9417 | 19960049 | -0.489458 | 0.491161 | 18.9180 |
| 2 | 19960052 | 0.000256268 | 0.00144722 | 18.9099 | 19960050 | -0.489883 | 0.491587 | 18.9142 |
| 3 | 19960048 | 0.00000 | 0.00170349 | 18.8489 | 19960054 | -0.494163 | 0.495867 | 18.8508 |