| Red | Green | Blue | |
| z | 17.64 | ||
| znorm | Inf | ||
| sky | -Inf | -NaN | -Inf |
| S/N | 26.0 | 47.1 | 52.9 |
| S/N(c) | 0.0 | 0.0 | 0.0 |
| SN(E/C) |
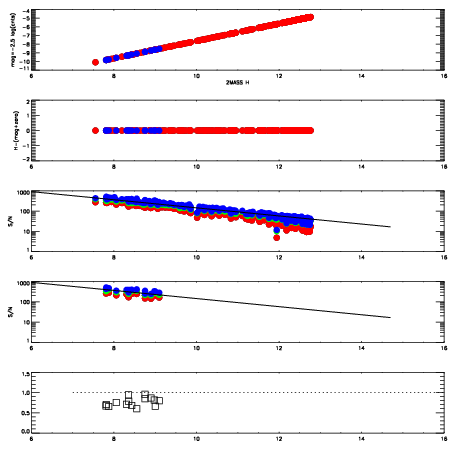
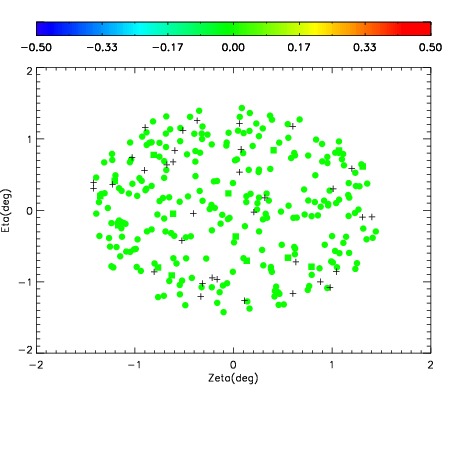
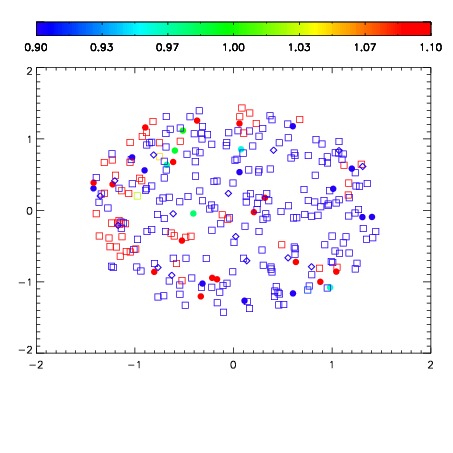
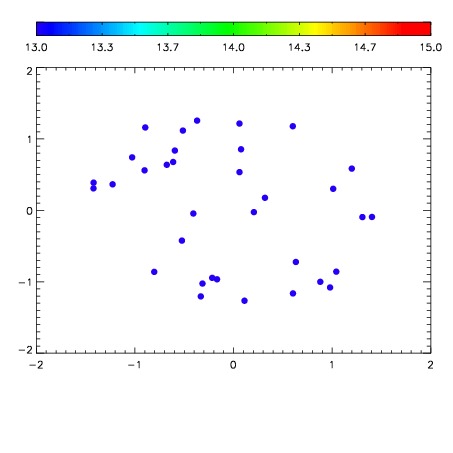

| Frame | Nreads | Zeropoints | Mag plots | Spatial mag deviation | Spatial sky 16325A emission deviations (filled: sky, open: star) | Spatial sky continuum emission | Spatial sky telluric CO2 absorption deviations (filled: H < 10) | |||||||||||||||||||||||
| 0 | 0 |
|
|
|
|
|
|
| IPAIR | NAME | SHIFT | NEWSHIFT | S/N | NAME | SHIFT | NEWSHIFT | S/N |
| 0 | 19980045 | 0.503779 | 0.00000 | 18.6995 | 19980043 | 0.00000 | 0.503779 | 18.6945 |
| 1 | 19980052 | 0.502963 | 0.000815988 | 18.8417 | 19980051 | 0.00365400 | 0.500125 | 18.7292 |
| 2 | 19980053 | 0.503495 | 0.000284016 | 18.8160 | 19980054 | 0.00456534 | 0.499214 | 18.7177 |
| 3 | 19980049 | 0.502518 | 0.00126100 | 18.6829 | 19980050 | 0.00331029 | 0.500469 | 18.6425 |
| 4 | 19980044 | 0.503762 | 1.69873e-05 | 18.6620 | 19980047 | 0.000184212 | 0.503595 | 18.6016 |
| 5 | 19980048 | 0.502330 | 0.00144899 | 18.6301 | 19980046 | 0.000102235 | 0.503677 | 18.5664 |