| Red | Green | Blue | |
| z | 17.64 | ||
| znorm | Inf | ||
| sky | -Inf | -NaN | -NaN |
| S/N | 27.3 | 44.2 | 48.3 |
| S/N(c) | 0.0 | 0.0 | 0.0 |
| SN(E/C) |

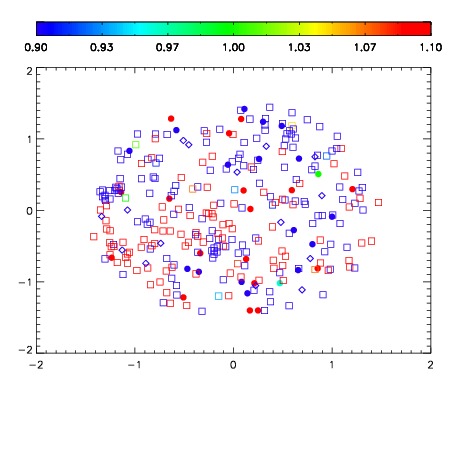
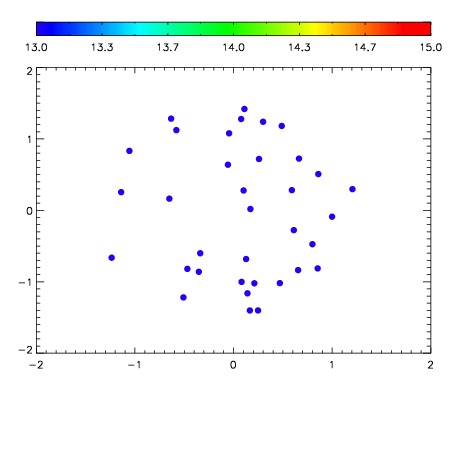

| Frame | Nreads | Zeropoints | Mag plots | Spatial mag deviation | Spatial sky 16325A emission deviations (filled: sky, open: star) | Spatial sky continuum emission | Spatial sky telluric CO2 absorption deviations (filled: H < 10) | |||||||||||||||||||||||
| 0 | 0 |
|
|
|
|
|
|
| IPAIR | NAME | SHIFT | NEWSHIFT | S/N | NAME | SHIFT | NEWSHIFT | S/N |
| 0 | 17600025 | 0.502794 | 0.00000 | 18.9752 | 17600023 | 0.00000 | 0.502794 | 18.9225 |
| 1 | 17600029 | 0.502368 | 0.000426054 | 19.1180 | 17600026 | -0.000111621 | 0.502906 | 19.0947 |
| 2 | 17600028 | 0.501869 | 0.000925004 | 19.1178 | 17600027 | -0.000918982 | 0.503713 | 19.0923 |
| 3 | 17600024 | 0.502335 | 0.000459015 | 18.9461 | 17600030 | -0.000648189 | 0.503442 | 17.2467 |