| Red | Green | Blue | |
| z | 17.64 | ||
| znorm | Inf | ||
| sky | -NaN | -NaN | -NaN |
| S/N | 29.2 | 49.2 | 53.9 |
| S/N(c) | 0.0 | 0.0 | 0.0 |
| SN(E/C) |
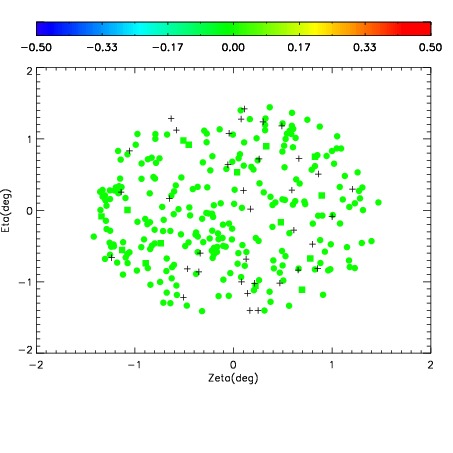
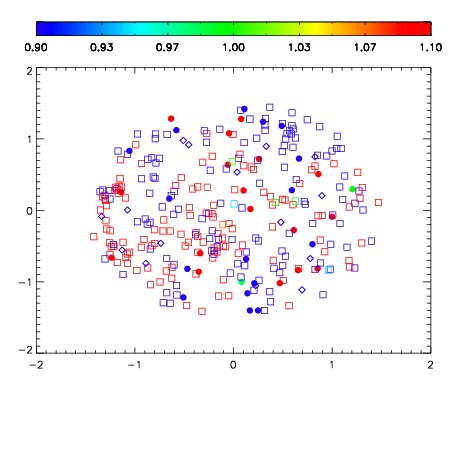
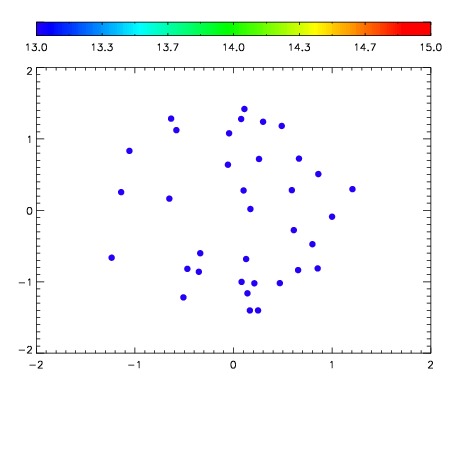

| Frame | Nreads | Zeropoints | Mag plots | Spatial mag deviation | Spatial sky 16325A emission deviations (filled: sky, open: star) | Spatial sky continuum emission | Spatial sky telluric CO2 absorption deviations (filled: H < 10) | |||||||||||||||||||||||
| 0 | 0 |
|
|
|
|
|
|
| IPAIR | NAME | SHIFT | NEWSHIFT | S/N | NAME | SHIFT | NEWSHIFT | S/N |
| 0 | 17840017 | 0.514125 | 0.00000 | 19.0739 | 17840015 | 0.00160262 | 0.512522 | 19.0693 |
| 1 | 17840013 | 0.513005 | 0.00111997 | 19.1183 | 17840011 | 0.00000 | 0.514125 | 19.1155 |
| 2 | 17840016 | 0.513084 | 0.00104100 | 19.1135 | 17840018 | 0.00334685 | 0.510778 | 19.1149 |
| 3 | 17840012 | 0.512470 | 0.00165498 | 19.1034 | 17840014 | 0.00159552 | 0.512529 | 19.0982 |