| Red | Green | Blue | |
| z | 17.64 | ||
| znorm | Inf | ||
| sky | -Inf | -Inf | -NaN |
| S/N | 25.7 | 43.9 | 47.6 |
| S/N(c) | 0.0 | 0.0 | 0.0 |
| SN(E/C) |
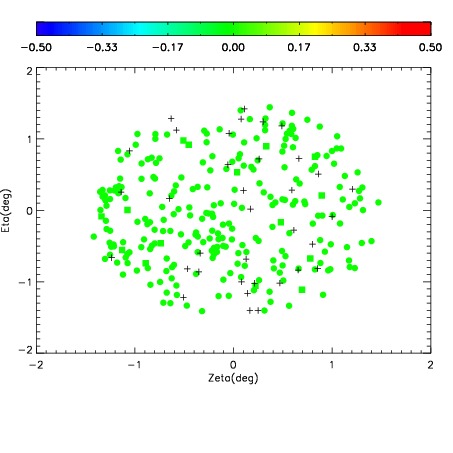
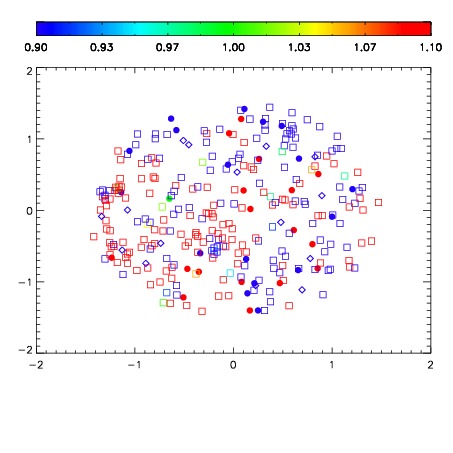
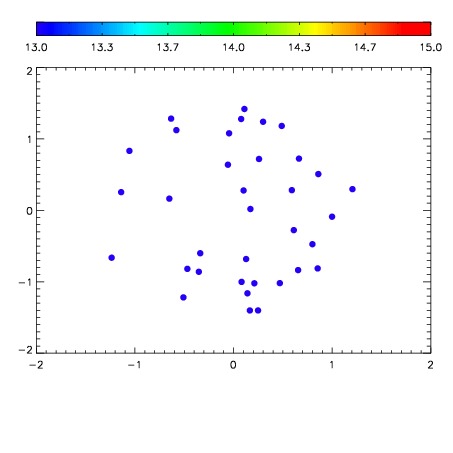

| Frame | Nreads | Zeropoints | Mag plots | Spatial mag deviation | Spatial sky 16325A emission deviations (filled: sky, open: star) | Spatial sky continuum emission | Spatial sky telluric CO2 absorption deviations (filled: H < 10) | |||||||||||||||||||||||
| 0 | 0 |
|
|
|
|
|
|
| IPAIR | NAME | SHIFT | NEWSHIFT | S/N | NAME | SHIFT | NEWSHIFT | S/N |
| 0 | 17870017 | 0.514276 | 0.00000 | 18.8961 | 17870018 | 0.00346000 | 0.510816 | 18.9160 |
| 1 | 17870016 | 0.513955 | 0.000321031 | 19.0069 | 17870015 | 0.00267158 | 0.511604 | 19.0531 |
| 2 | 17870013 | 0.512931 | 0.00134504 | 18.9628 | 17870014 | 0.00335644 | 0.510920 | 19.0259 |
| 3 | 17870012 | 0.512099 | 0.00217700 | 18.7836 | 17870011 | 0.00000 | 0.514276 | 18.6494 |