| Red | Green | Blue | |
| z | 17.64 | ||
| znorm | Inf | ||
| sky | -NaN | -NaN | -NaN |
| S/N | 24.3 | 41.7 | 44.5 |
| S/N(c) | 0.0 | 0.0 | 0.0 |
| SN(E/C) |

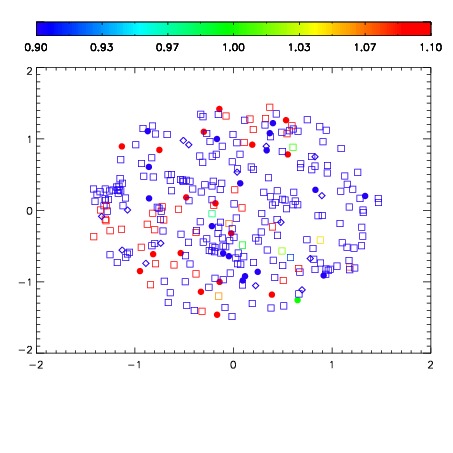


| Frame | Nreads | Zeropoints | Mag plots | Spatial mag deviation | Spatial sky 16325A emission deviations (filled: sky, open: star) | Spatial sky continuum emission | Spatial sky telluric CO2 absorption deviations (filled: H < 10) | |||||||||||||||||||||||
| 0 | 0 |
|
|
|
|
|
|
| IPAIR | NAME | SHIFT | NEWSHIFT | S/N | NAME | SHIFT | NEWSHIFT | S/N |
| 0 | 20030033 | 0.503690 | 0.00000 | 18.9939 | 20030036 | 0.00940678 | 0.494283 | 19.0318 |
| 1 | 20030037 | 0.500321 | 0.00336903 | 19.0224 | 20030035 | 0.00856893 | 0.495121 | 19.0397 |
| 2 | 20030034 | 0.503606 | 8.39829e-05 | 18.9899 | 20030032 | 0.00000 | 0.503690 | 19.0131 |