| Red | Green | Blue | |
| z | 17.64 | ||
| znorm | Inf | ||
| sky | -Inf | -Inf | -Inf |
| S/N | 33.3 | 53.3 | 60.0 |
| S/N(c) | 0.0 | 0.0 | 0.0 |
| SN(E/C) |

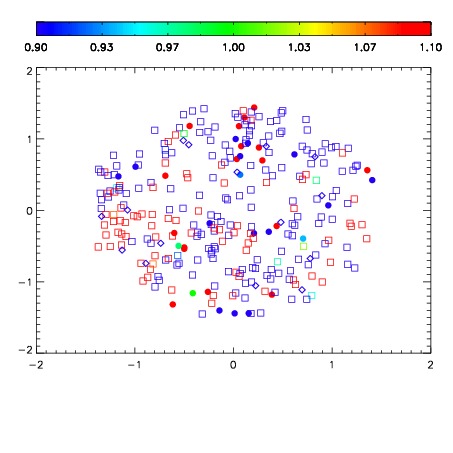
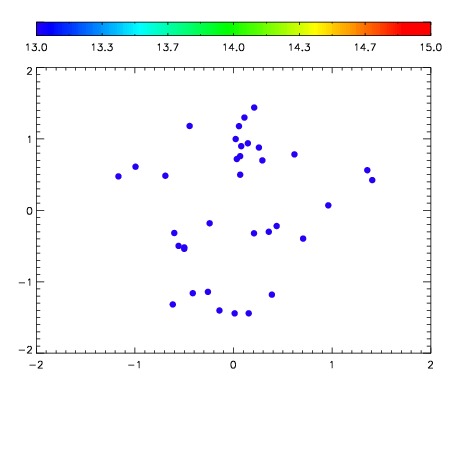

| Frame | Nreads | Zeropoints | Mag plots | Spatial mag deviation | Spatial sky 16325A emission deviations (filled: sky, open: star) | Spatial sky continuum emission | Spatial sky telluric CO2 absorption deviations (filled: H < 10) | |||||||||||||||||||||||
| 0 | 0 |
|
|
|
|
|
|
| IPAIR | NAME | SHIFT | NEWSHIFT | S/N | NAME | SHIFT | NEWSHIFT | S/N |
| 0 | 20040019 | 0.000928017 | 0.00000 | 18.9363 | 20040017 | -0.505172 | 0.506100 | 18.9307 |
| 1 | 20040023 | -0.00178148 | 0.00270950 | 18.9947 | 20040024 | -0.505668 | 0.506596 | 19.0212 |
| 2 | 20040022 | -0.00227282 | 0.00320084 | 18.9437 | 20040020 | -0.504725 | 0.505653 | 18.9624 |
| 3 | 20040018 | 0.000713969 | 0.000214048 | 18.9123 | 20040021 | -0.505246 | 0.506174 | 18.9264 |
| 4 | 20040015 | 0.00000 | 0.000928017 | 18.8662 | 20040016 | -0.504307 | 0.505235 | 18.9228 |