| Red | Green | Blue | |
| z | 17.64 | ||
| znorm | Inf | ||
| sky | -Inf | -Inf | -Inf |
| S/N | 28.5 | 45.6 | 54.0 |
| S/N(c) | 0.0 | 0.0 | 0.0 |
| SN(E/C) |
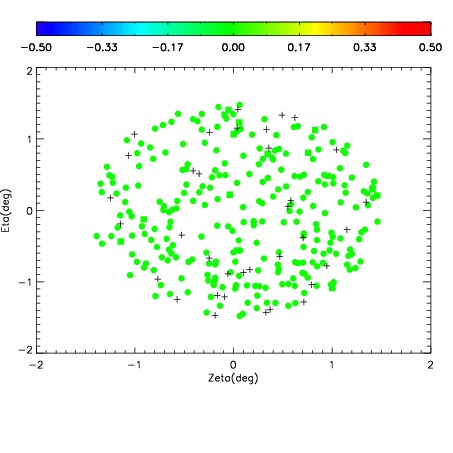
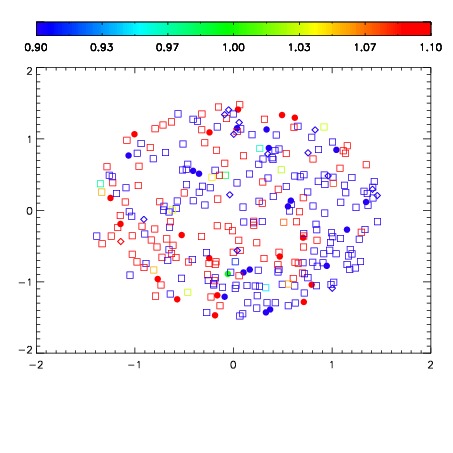
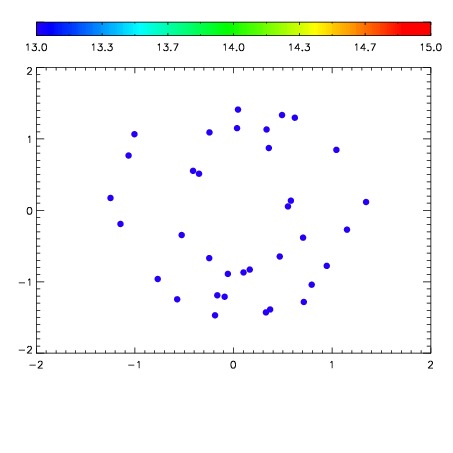

| Frame | Nreads | Zeropoints | Mag plots | Spatial mag deviation | Spatial sky 16325A emission deviations (filled: sky, open: star) | Spatial sky continuum emission | Spatial sky telluric CO2 absorption deviations (filled: H < 10) | |||||||||||||||||||||||
| 0 | 0 |
|
|
|
|
|
|
| IPAIR | NAME | SHIFT | NEWSHIFT | S/N | NAME | SHIFT | NEWSHIFT | S/N |
| 0 | 17610026 | 0.506921 | 0.00000 | 19.0070 | 17610027 | -0.00205856 | 0.508980 | 18.9996 |
| 1 | 17610021 | 0.506105 | 0.000815988 | 19.1035 | 17610020 | 0.00000 | 0.506921 | 19.0848 |
| 2 | 17610022 | 0.506603 | 0.000317991 | 19.0644 | 17610023 | -0.00430767 | 0.511229 | 19.0826 |
| 3 | 17610025 | 0.506516 | 0.000405014 | 19.0484 | 17610024 | -0.00432114 | 0.511242 | 19.0142 |