| Red | Green | Blue | |
| z | 17.64 | ||
| znorm | Inf | ||
| sky | -NaN | -NaN | -NaN |
| S/N | 23.1 | 37.9 | 48.4 |
| S/N(c) | 0.0 | 0.0 | 0.0 |
| SN(E/C) |
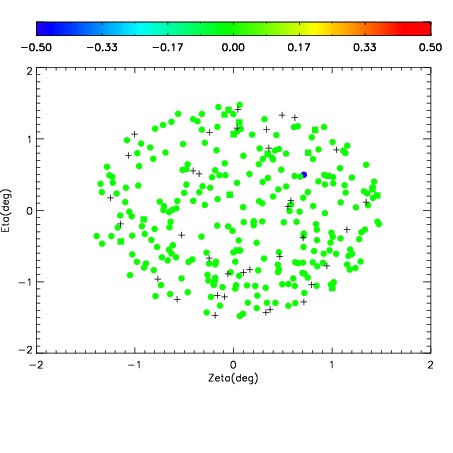
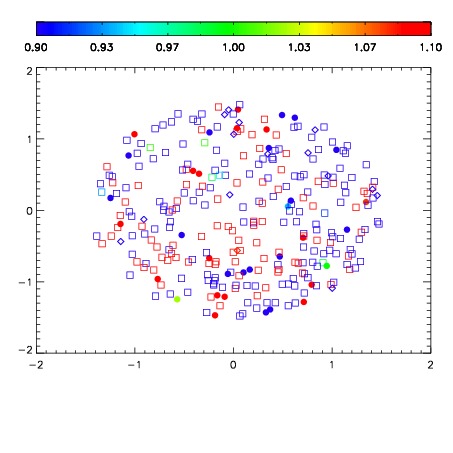


| Frame | Nreads | Zeropoints | Mag plots | Spatial mag deviation | Spatial sky 16325A emission deviations (filled: sky, open: star) | Spatial sky continuum emission | Spatial sky telluric CO2 absorption deviations (filled: H < 10) | |||||||||||||||||||||||
| 0 | 0 |
|
|
|
|
|
|
| IPAIR | NAME | SHIFT | NEWSHIFT | S/N | NAME | SHIFT | NEWSHIFT | S/N |
| 0 | 19720067 | 0.488827 | 0.00000 | 18.9835 | 19720062 | 0.00000 | 0.488827 | 18.9266 |
| 1 | 19720063 | 0.487403 | 0.00142398 | 18.9966 | 19720066 | -0.0107682 | 0.499595 | 18.9383 |
| 2 | 19720064 | 0.487729 | 0.00109798 | 18.9218 | 19720065 | -0.0100691 | 0.498896 | 18.9196 |