| Red | Green | Blue | |
| z | 17.64 | ||
| znorm | Inf | ||
| sky | -Inf | -Inf | -Inf |
| S/N | 28.3 | 47.9 | 56.2 |
| S/N(c) | 0.0 | 0.0 | 0.0 |
| SN(E/C) |
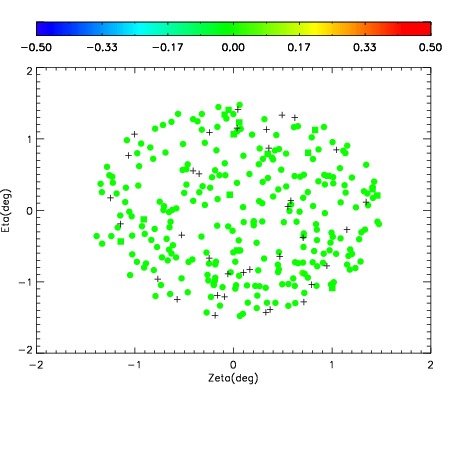
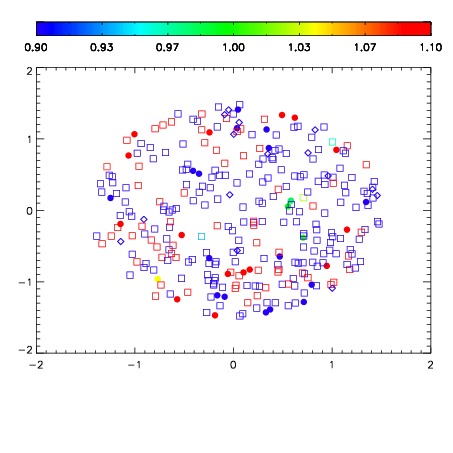


| Frame | Nreads | Zeropoints | Mag plots | Spatial mag deviation | Spatial sky 16325A emission deviations (filled: sky, open: star) | Spatial sky continuum emission | Spatial sky telluric CO2 absorption deviations (filled: H < 10) | |||||||||||||||||||||||
| 0 | 0 |
|
|
|
|
|
|
| IPAIR | NAME | SHIFT | NEWSHIFT | S/N | NAME | SHIFT | NEWSHIFT | S/N |
| 0 | 19760046 | 0.00000 | 0.00000 | 18.9129 | 19760047 | -0.497296 | 0.497296 | 18.9342 |
| 1 | 19760049 | -0.00297143 | 0.00297143 | 19.0438 | 19760052 | -0.494795 | 0.494795 | 19.0497 |
| 2 | 19760054 | -0.000198296 | 0.000198296 | 19.0072 | 19760051 | -0.495084 | 0.495084 | 19.0366 |
| 3 | 19760050 | -0.00238826 | 0.00238826 | 18.9936 | 19760055 | -0.497283 | 0.497283 | 19.0263 |
| 4 | 19760053 | -0.000367419 | 0.000367419 | 18.9410 | 19760048 | -0.497775 | 0.497775 | 18.9981 |