| Red | Green | Blue | |
| z | 17.64 | ||
| znorm | Inf | ||
| sky | -Inf | -Inf | -NaN |
| S/N | 27.7 | 46.3 | 55.2 |
| S/N(c) | 0.0 | 0.0 | 0.0 |
| SN(E/C) |
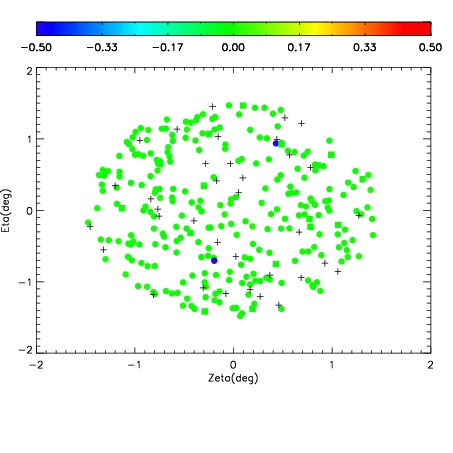
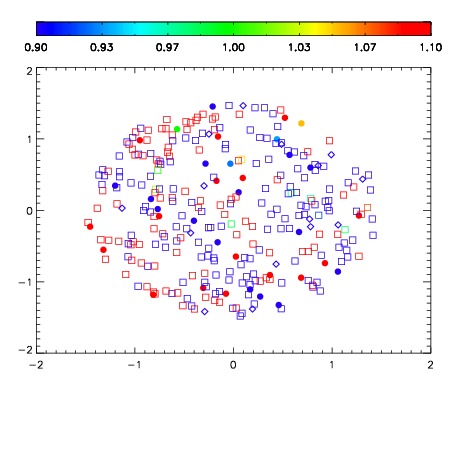
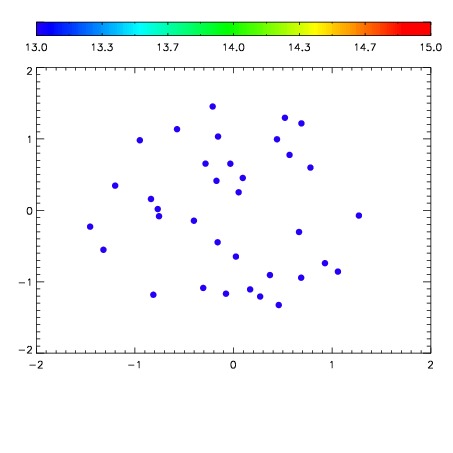

| Frame | Nreads | Zeropoints | Mag plots | Spatial mag deviation | Spatial sky 16325A emission deviations (filled: sky, open: star) | Spatial sky continuum emission | Spatial sky telluric CO2 absorption deviations (filled: H < 10) | |||||||||||||||||||||||
| 0 | 0 |
|
|
|
|
|
|
| IPAIR | NAME | SHIFT | NEWSHIFT | S/N | NAME | SHIFT | NEWSHIFT | S/N |
| 0 | 17620018 | 0.499968 | 0.00000 | 19.0171 | 17620019 | -0.00139877 | 0.501367 | 19.0879 |
| 1 | 17620017 | 0.499471 | 0.000496984 | 18.9973 | 17620016 | -0.00134460 | 0.501313 | 18.9978 |
| 2 | 17620014 | 0.496995 | 0.00297299 | 18.9799 | 17620012 | 0.00000 | 0.499968 | 18.9434 |
| 3 | 17620013 | 0.496995 | 0.00297299 | 18.9145 | 17620015 | -0.000874670 | 0.500843 | 18.9390 |