| Red | Green | Blue | |
| z | 17.64 | ||
| znorm | Inf | ||
| sky | -Inf | -Inf | -Inf |
| S/N | 31.3 | 54.5 | 60.9 |
| S/N(c) | 0.0 | 0.0 | 0.0 |
| SN(E/C) |
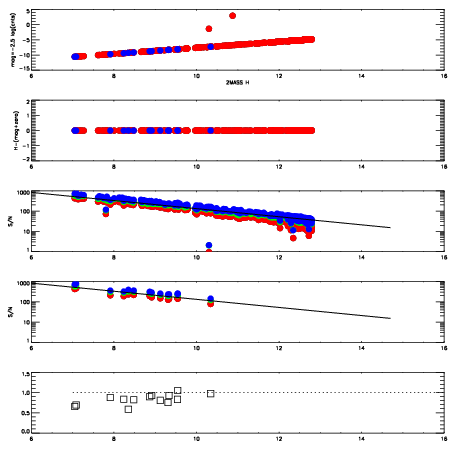
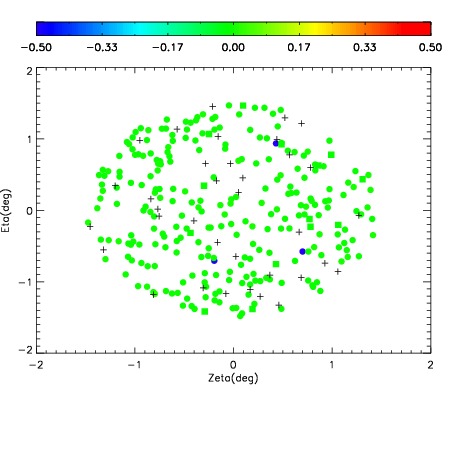

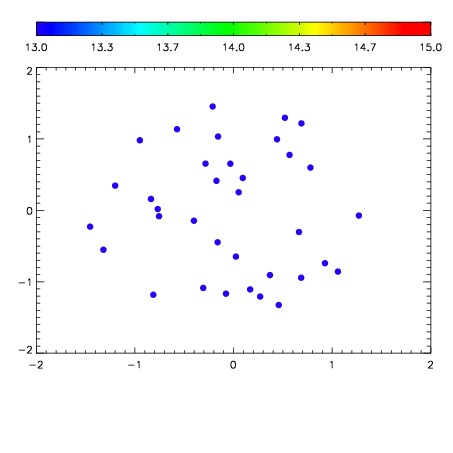

| Frame | Nreads | Zeropoints | Mag plots | Spatial mag deviation | Spatial sky 16325A emission deviations (filled: sky, open: star) | Spatial sky continuum emission | Spatial sky telluric CO2 absorption deviations (filled: H < 10) | |||||||||||||||||||||||
| 0 | 0 |
|
|
|
|
|
|
| IPAIR | NAME | SHIFT | NEWSHIFT | S/N | NAME | SHIFT | NEWSHIFT | S/N |
| 0 | 17860034 | 0.516655 | 0.00000 | 18.9540 | 17860033 | 0.00000 | 0.516655 | 18.8792 |
| 1 | 17860039 | 0.514940 | 0.00171500 | 19.0155 | 17860040 | 0.000209954 | 0.516445 | 18.9804 |
| 2 | 17860035 | 0.515772 | 0.000883043 | 19.0011 | 17860036 | 0.000621978 | 0.516033 | 18.9340 |
| 3 | 17860038 | 0.514234 | 0.00242102 | 18.9978 | 17860037 | 7.55897e-05 | 0.516579 | 18.9055 |
| 4 | 17860042 | 0.514108 | 0.00254703 | 18.7958 | 17860041 | -0.000209782 | 0.516865 | 18.8506 |