| Red | Green | Blue | |
| z | 17.64 | ||
| znorm | Inf | ||
| sky | -Inf | -Inf | -NaN |
| S/N | 16.1 | 27.8 | 30.9 |
| S/N(c) | 0.0 | 0.0 | 0.0 |
| SN(E/C) |
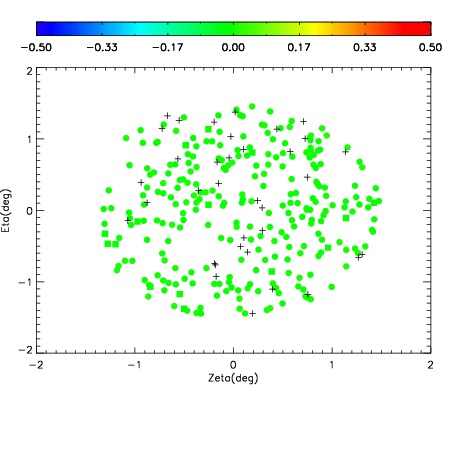
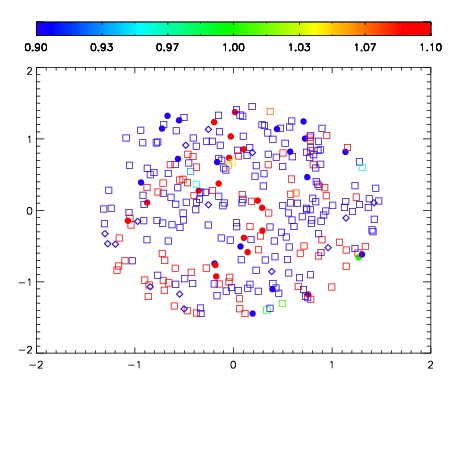
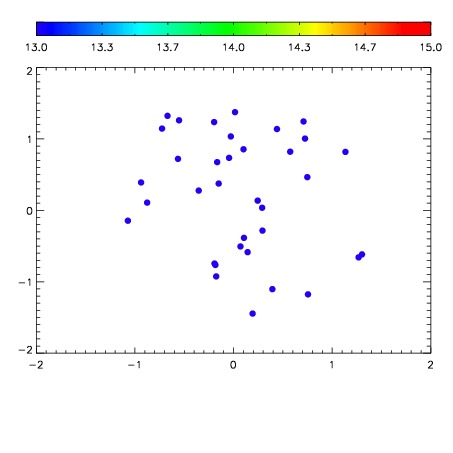

| Frame | Nreads | Zeropoints | Mag plots | Spatial mag deviation | Spatial sky 16325A emission deviations (filled: sky, open: star) | Spatial sky continuum emission | Spatial sky telluric CO2 absorption deviations (filled: H < 10) | |||||||||||||||||||||||
| 0 | 0 |
|
|
|
|
|
|
| IPAIR | NAME | SHIFT | NEWSHIFT | S/N | NAME | SHIFT | NEWSHIFT | S/N |
| 0 | 17600013 | 0.506936 | 0.00000 | 18.7210 | 17600011 | 0.00000 | 0.506936 | 19.0111 |
| 1 | 17600017 | 0.505560 | 0.00137603 | 18.3542 | 17600015 | 0.00356195 | 0.503374 | 18.7614 |
| 2 | 17600016 | 0.504979 | 0.00195700 | 17.8488 | 17600014 | 0.00359226 | 0.503344 | 18.2842 |
| 3 | 17600012 | 0.505047 | 0.00188899 | 16.4106 | 17600018 | 0.00474156 | 0.502194 | 17.2293 |