| Red | Green | Blue | |
| z | 17.64 | ||
| znorm | Inf | ||
| sky | -Inf | -Inf | -Inf |
| S/N | 20.1 | 36.4 | 42.7 |
| S/N(c) | 0.0 | 0.0 | 0.0 |
| SN(E/C) |
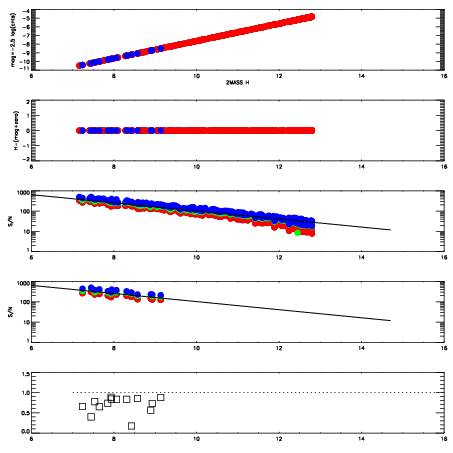
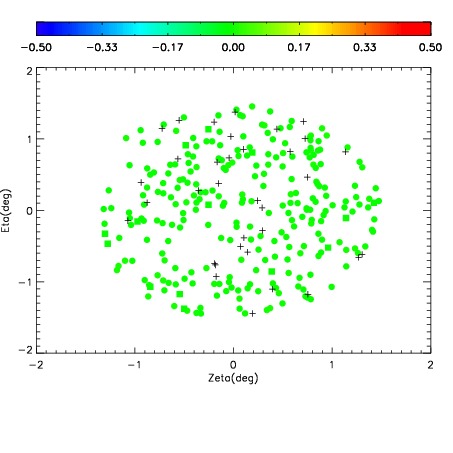
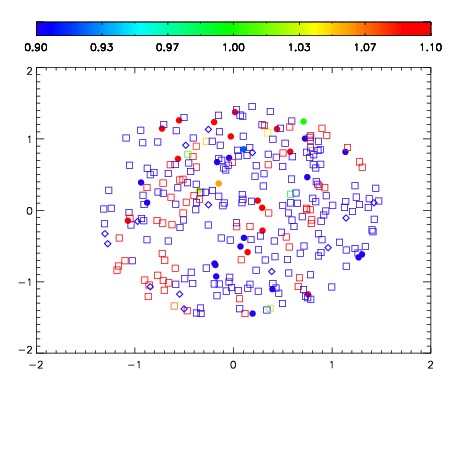


| Frame | Nreads | Zeropoints | Mag plots | Spatial mag deviation | Spatial sky 16325A emission deviations (filled: sky, open: star) | Spatial sky continuum emission | Spatial sky telluric CO2 absorption deviations (filled: H < 10) | |||||||||||||||||||||||
| 0 | 0 |
|
|
|
|
|
|
| IPAIR | NAME | SHIFT | NEWSHIFT | S/N | NAME | SHIFT | NEWSHIFT | S/N |
| 0 | 19730073 | 0.493847 | 0.00000 | 18.9718 | 19730071 | 0.00170941 | 0.492138 | 18.9284 |
| 1 | 19730069 | 0.491493 | 0.00235403 | 18.9997 | 19730068 | 0.00000 | 0.493847 | 18.9540 |
| 2 | 19730070 | 0.492131 | 0.00171602 | 18.9787 | 19730072 | 0.00156804 | 0.492279 | 18.9441 |