| Red | Green | Blue | |
| z | 17.64 | ||
| znorm | Inf | ||
| sky | -Inf | -Inf | -NaN |
| S/N | 22.7 | 39.7 | 44.6 |
| S/N(c) | 0.0 | 0.0 | 0.0 |
| SN(E/C) |

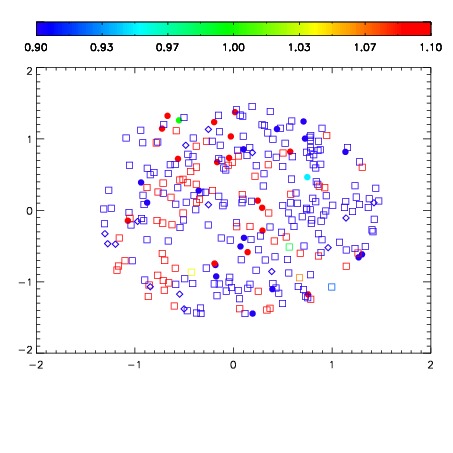


| Frame | Nreads | Zeropoints | Mag plots | Spatial mag deviation | Spatial sky 16325A emission deviations (filled: sky, open: star) | Spatial sky continuum emission | Spatial sky telluric CO2 absorption deviations (filled: H < 10) | |||||||||||||||||||||||
| 0 | 0 |
|
|
|
|
|
|
| IPAIR | NAME | SHIFT | NEWSHIFT | S/N | NAME | SHIFT | NEWSHIFT | S/N |
| 0 | 19930066 | 0.00462360 | 0.00000 | 18.8595 | 19930067 | -0.487815 | 0.492439 | 18.7264 |
| 1 | 19930065 | 0.00440551 | 0.000218090 | 18.8235 | 19930063 | -0.491292 | 0.495916 | 18.6542 |
| 2 | 19930062 | 0.00000 | 0.00462360 | 18.6901 | 19930064 | -0.490420 | 0.495044 | 18.6494 |
| 3 | 19930069 | 0.00400891 | 0.000614690 | 18.4001 | 19930068 | -0.488152 | 0.492776 | 18.6010 |