| Red | Green | Blue | |
| z | 17.64 | ||
| znorm | Inf | ||
| sky | -Inf | -Inf | -NaN |
| S/N | 19.0 | 34.7 | 38.5 |
| S/N(c) | 0.0 | 0.0 | 0.0 |
| SN(E/C) |
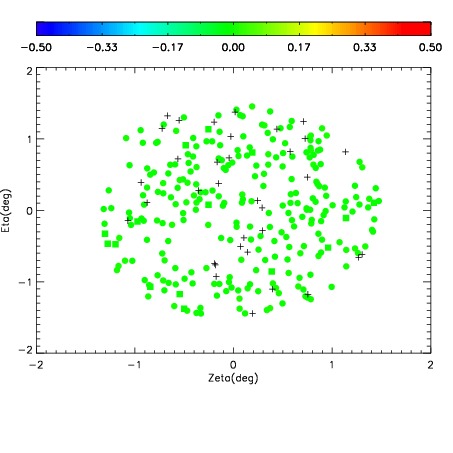
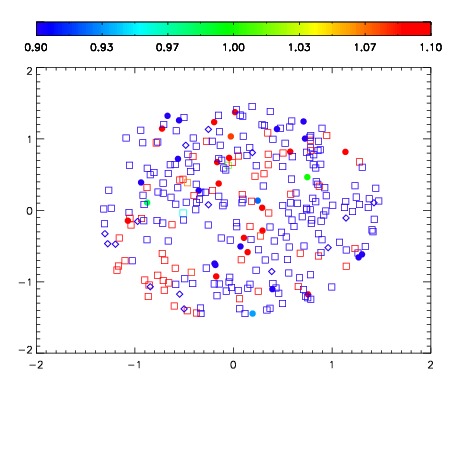


| Frame | Nreads | Zeropoints | Mag plots | Spatial mag deviation | Spatial sky 16325A emission deviations (filled: sky, open: star) | Spatial sky continuum emission | Spatial sky telluric CO2 absorption deviations (filled: H < 10) | |||||||||||||||||||||||
| 0 | 0 |
|
|
|
|
|
|
| IPAIR | NAME | SHIFT | NEWSHIFT | S/N | NAME | SHIFT | NEWSHIFT | S/N |
| 0 | 19960059 | 0.00000 | 0.00000 | 18.7275 | 19960061 | -0.489847 | 0.489847 | 18.7567 |
| 1 | 19960062 | -0.00127601 | 0.00127601 | 18.7963 | 19960060 | -0.490096 | 0.490096 | 18.7831 |
| 2 | 19960063 | -0.000194217 | 0.000194217 | 18.5964 | 19960064 | -0.490306 | 0.490306 | 18.6677 |