| Red | Green | Blue | |
| z | 17.64 | ||
| znorm | Inf | ||
| sky | -Inf | -Inf | -Inf |
| S/N | 19.8 | 34.5 | 37.6 |
| S/N(c) | 0.0 | 0.0 | 0.0 |
| SN(E/C) |

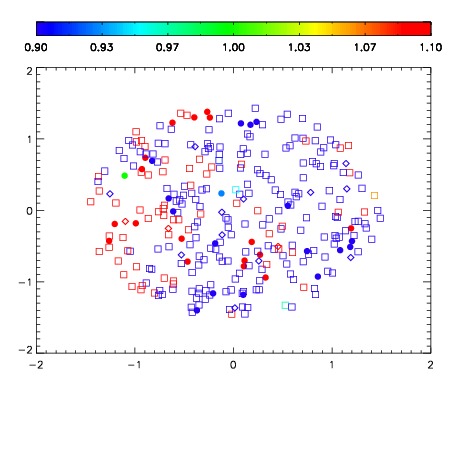


| Frame | Nreads | Zeropoints | Mag plots | Spatial mag deviation | Spatial sky 16325A emission deviations (filled: sky, open: star) | Spatial sky continuum emission | Spatial sky telluric CO2 absorption deviations (filled: H < 10) | |||||||||||||||||||||||
| 0 | 0 |
|
|
|
|
|
|
| IPAIR | NAME | SHIFT | NEWSHIFT | S/N | NAME | SHIFT | NEWSHIFT | S/N |
| 0 | 17570041 | 0.00156030 | 0.00000 | 18.6094 | 17570042 | -0.505624 | 0.507184 | 18.6145 |
| 1 | 17570036 | 0.00000 | 0.00156030 | 18.6693 | 17570043 | -0.505914 | 0.507474 | 18.7095 |
| 2 | 17570039 | 0.00110630 | 0.000454000 | 18.5177 | 17570037 | -0.504535 | 0.506095 | 18.5960 |