| Red | Green | Blue | |
| z | 17.64 | ||
| znorm | Inf | ||
| sky | -Inf | -Inf | -NaN |
| S/N | 28.4 | 45.4 | 52.6 |
| S/N(c) | 0.0 | 0.0 | 0.0 |
| SN(E/C) |
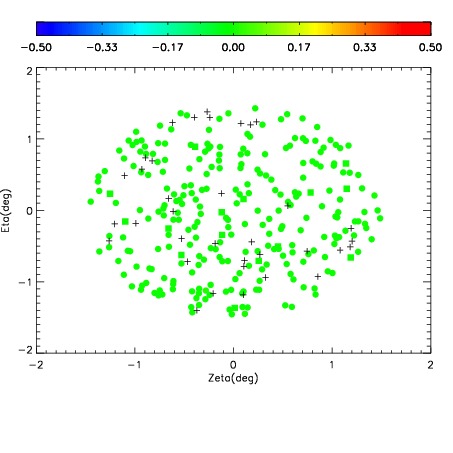
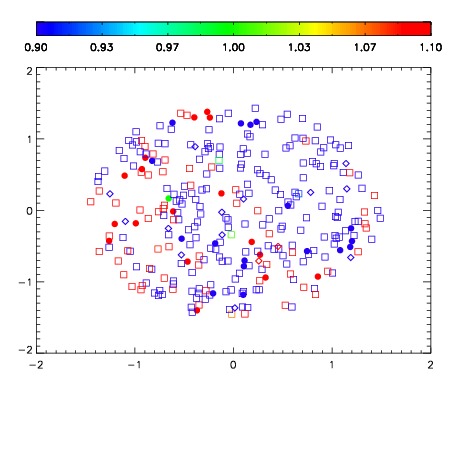


| Frame | Nreads | Zeropoints | Mag plots | Spatial mag deviation | Spatial sky 16325A emission deviations (filled: sky, open: star) | Spatial sky continuum emission | Spatial sky telluric CO2 absorption deviations (filled: H < 10) | |||||||||||||||||||||||
| 0 | 0 |
|
|
|
|
|
|
| IPAIR | NAME | SHIFT | NEWSHIFT | S/N | NAME | SHIFT | NEWSHIFT | S/N |
| 0 | 17650012 | 0.499652 | 0.00000 | 18.8578 | 17650015 | -0.00203503 | 0.501687 | 18.7863 |
| 1 | 17650016 | 0.498323 | 0.00132900 | 18.9309 | 17650018 | -0.00256062 | 0.502213 | 18.9399 |
| 2 | 17650017 | 0.498176 | 0.00147599 | 18.9089 | 17650011 | 0.00000 | 0.499652 | 18.8763 |
| 3 | 17650013 | 0.499533 | 0.000119001 | 18.8862 | 17650014 | -0.00152696 | 0.501179 | 18.8513 |